ERS Charts of Note
Subscribe to get highlights from our current and past research, Monday through Friday, or see our privacy policy.
Get the latest charts via email, or on our mobile app for  and
and 
Wednesday, December 5, 2012
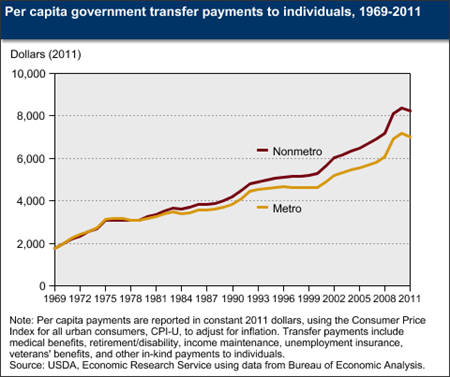
Government transfer payments comprise a large share of personal income for both nonmetro and metro residents. In 2011, transfer payments to individuals accounted for 24.8 percent of total personal income in nonmetro areas and 16.3 percent in metro areas. Per capita in 2011, nonmetro residents received more government transfers than metro residents: $8,236 vs. $7,022. Since 1978, nonmetro per capita transfer payments (adjusted for inflation) have risen faster than payments in metro areas. Most of this increase comes from the rising cost of government programs that provide medical benefits, such as Medicare and Medicaid. Because nonmetro areas have an older population and a higher proportion of persons with disabilities than metro areas, nonmetro areas receive more transfer payments. Between 2010 and 2011, per capita transfer payments fell, primarily due to a decline in unemployment insurance compensation, which fell 25 percent in both metro and nonmetro areas as benefits expired. This chart is found in the Rural Poverty & Well-being topic page on the ERS website, updated November 2012.
Wednesday, September 26, 2012
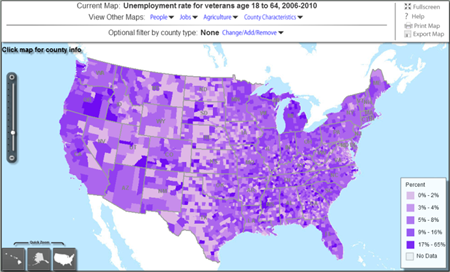
Between 2006 and 2010, an estimated 6.6 percent of the Veteran population was unemployed. However, the unemployment rate varied greatly by region and county. On average, counties in the South and the West had the highest rates (6.7 percent). The average for nonmetro counties (6.7 percent) was higher than the average for metro counties (6.4 percent). Overall, nonmetro counties in the South had the highest average Veteran unemployment rate (7.0 percent). The Veteran unemployment rate was also high in historically manufacturing dependent counties in the Midwest. These geographic patterns are similar to those for unemployment among the civilian adult population as a whole. This map is from the Atlas of Rural and Small-Town America on the ERS website. Today, ERS is co-hosting Veterans, Reservists, and Military Families (VRMF) Data and Research Workshop.
Monday, August 6, 2012
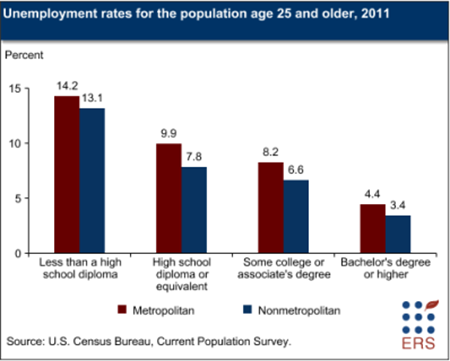
Unemployment rates are lower for those with more educational attainment, partly due to increasing demand for more highly-skilled labor. In 2011, the unemployment rate for nonmetro adults age 25 and older without a high school diploma was 13.1 percent. Unemployment rates were lowest for adults with a bachelor's degree or higher (3.4 percent) in nonmetro areas. Metro areas have had slightly higher unemployment rates than nonmetro areas across all educational attainment categories since the onset of the most recent recession. This chart is from the Employment and Education topic page on the ERS website, updated July 17, 2012.
Friday, July 13, 2012
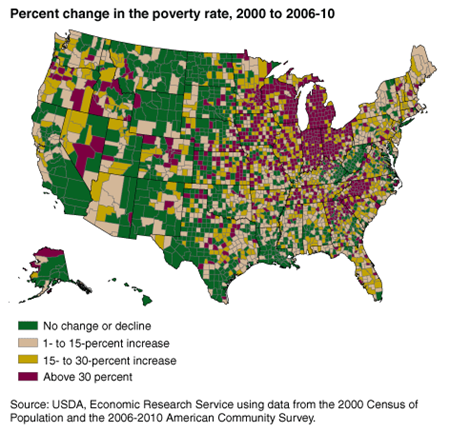
Nationally, the share of Americans living below the poverty threshold increased from 12.4 percent in 2000 to 13.8 percent in 2006-10. But in nearly one-quarter (762) of U.S. counties, the poverty rate increased by 30 percent or more, while another 878 counties saw no change or experienced declining poverty. Of the counties that had increases of 30 percent or more, 58 percent were in rural areas. Increases in the poverty rate were often highest in regions that suffered the largest increases in unemployment rates during the 2007-09 recession. Many were manufacturing-dependent counties located in the Great Lakes and Southern Highland regions. This chart appeared in the June 2012 issue of Amber Waves magazine.
Wednesday, January 18, 2012
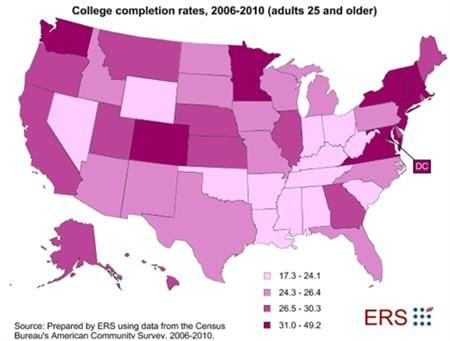
Newly available data from the American Community Survey show rates of college completion (completion of at least a bachelor's degree) for adults age 25 and older vary across U.S. States and counties. The highest rate of college completion, based on data collected in 2006-10, was recorded for the District of Columbia at 49.2 percent. The lowest rate, 17.3 percent, was found in West Virginia. This map is found in the ERS data product, County-Level Education Data, on the ERS website, updated January 17, 2012.
Monday, October 17, 2011
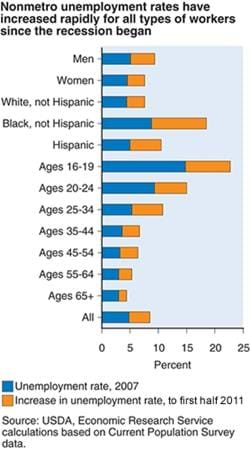
The recession widened existing demographic differences in nonmetro unemployment rates. Between 2007 and the first half of 2011, unemployment among nonmetro men grew by a larger margin than did women's due to rapid job losses in male-dominated industries, such as construction and manufacturing, and better employment conditions in fields such as health care and educational services, where women are well represented. Unemployment among nonmetro Blacks grew by 9.7 percentage points, compared to 5.5 percentage points for Hispanics and 3.2 percentage points for non-Hispanic Whites. Unemployment among 16- to 19-year-olds increased by 7.9 percentage points, to 22.6 percent in nonmetro counties. This chart is from the 2011 edition of Rural America At A Glance, EIB-85, September 2011.


