
Increases in the U.S. poverty rate were highest in the manufacturing areas of the Midwest and South
- by Economic Research Service
- 7/13/2012
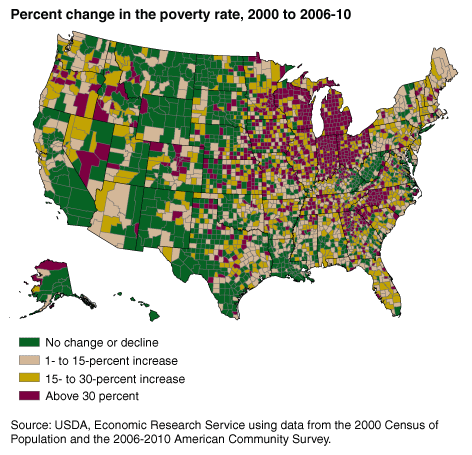
Nationally, the share of Americans living below the poverty threshold increased from 12.4 percent in 2000 to 13.8 percent in 2006-10. But in nearly one-quarter (762) of U.S. counties, the poverty rate increased by 30 percent or more, while another 878 counties saw no change or experienced declining poverty. Of the counties that had increases of 30 percent or more, 58 percent were in rural areas. Increases in the poverty rate were often highest in regions that suffered the largest increases in unemployment rates during the 2007-09 recession. Many were manufacturing-dependent counties located in the Great Lakes and Southern Highland regions. This chart appeared in the June 2012 issue of Amber Waves magazine.