ERS Charts of Note
Subscribe to get highlights from our current and past research, Monday through Friday, or see our privacy policy.
Get the latest charts via email, or on our mobile app for  and
and 
Tuesday, March 29, 2011
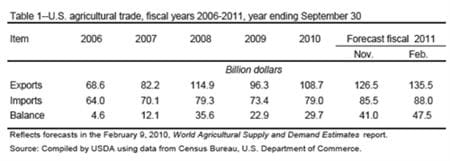
As of February 2011, fiscal 2011 agricultural exports are forecast at a record $135.5 billion, up $9 billion from the November forecast and $26.8 billion above 2010. Exports are forecast to exceed the previous record set in 2008 by $20.6 billion. Sharply higher unit values for grains, soybeans, and cotton account for most of the forecast increase. This table appears in the ERS report, Outlook for U.S. Agricultural Trade, AES-69, February 2011.
Wednesday, March 23, 2011
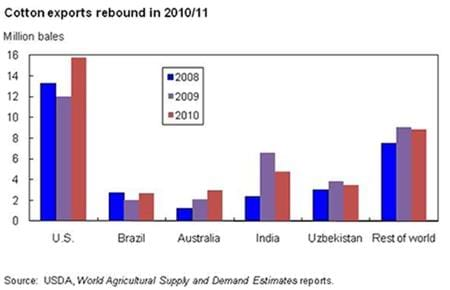
As of March 2011, world cotton exports in 2010/11 are estimated at 38.6 million bales, up 9 percent from the previous year and the second consecutive year of trade rebound. Exports in 2010/11 for Australia (3.0 million bales), Brazil (2.7 million), and the United States (15.75 million) are estimated to increase 42 percent, 36 percent, and 27 percent, respectively, from the preceding year. India and Uzbekistan are estimated to export 4.8 million bales and 3.5 million bales in 2010/11, down 27 percent and 8 percent, respectively, from a year ago. Export increases in several major countries more than offset declines in other exporting countries, resulting in one of the largest cotton trade volumes in recent years. This chart was originally published in Cotton and Wool Outlook, CWS-11a, March 11, 2011.
Tuesday, March 15, 2011
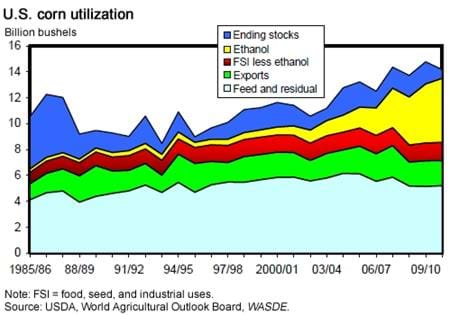
Projected domestic corn use increased in February by 70 million bushels, as demand remained strong in 2010/11 despite record-high corn farm prices. Leading the change is a 50-million-bushel increase in the projection of corn used for ethanol. Food and other industrial use is projected to increase by 20 million bushels. The export projection remains unchanged. Ending stocks for corn, relative to use, are at their lowest levels since 1995/96. This chart was originally published in Feed Outlook, FDS-11b, February 2011.
Monday, March 7, 2011
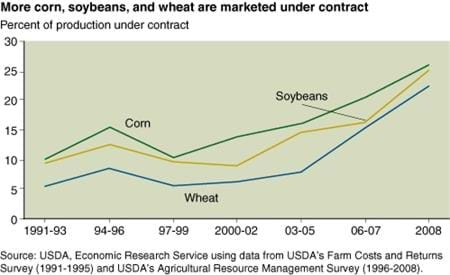
Most U.S. corn, soybean, and wheat production is sold through cash markets, where the producer receives the market price prevailing at the time of sale. However, marketing contracts, which set a market outlet and a pricing arrangement for crops before they are harvested, are becoming increasingly important as risk management tools. Marketing contracts covered 15 percent of corn production in 2001, along with 9 percent of soybean and 6 percent of wheat production. By 2008, contracts covered 26 percent of corn, 25 percent of soybean, and 23 percent of wheat production. This chart originally appeared in the March 2011 issue of Amber Waves. It is based on the ERS publication, Agricultural Contracting Update: Contracts in 2008, EIB-72, February 2011.
Friday, March 4, 2011
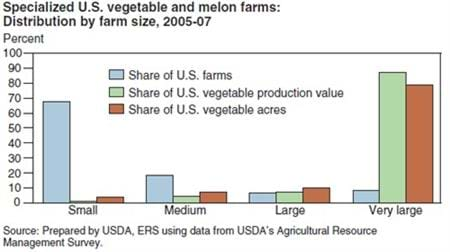
As with most agricultural commodities, vegetable production has become increasingly concentrated over time as larger, more efficient farms have garnered a greater share of the domestic market. Thus, it is no surprise that ARMS data reveal that a majority of U.S. vegetable output comes from the largest farms. About 8 percent of all specialized vegetable and melon farms produced $1 million or more of agricultural commodities per year during 2005-07. These large commercial farms accounted for 87 percent of the total value of U.S. vegetable production. Given the relatively high per acre values of such crops as potatoes, tomatoes, peppers, and asparagus, harvested area of these commodities is highly concentrated among farms with more than $1 million in sales per year. This figure is from Financial Characteristics of Vegetable and Melon Farms, VGS-342-01, February 2011.
Monday, February 28, 2011
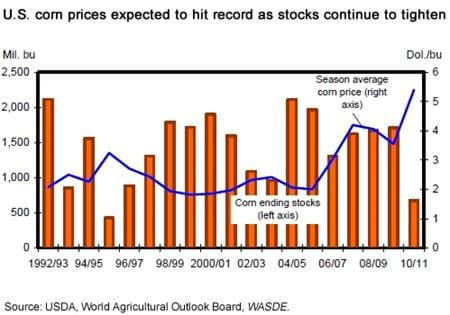
Given the low stocks-to-use ratio projected for corn, increasing market prices are likely to ration demand for the balance of the year. It is assumed by many that the stocks-to-use ratio cannot fall below the current projection of 5 percent. This level translates into about an 18-day supply of old-crop corn at the beginning of the 2011/12 marketing year; however, some new-crop corn is usually harvested and available for use before the September 1 start of the new marketing year. If the March planting intentions show a sizeable increase in corn plantings and weather is generally favorable this spring, corn prices may moderate. However, if the planting intentions do not show a significant increase in acreage, corn development gets off to a slow start, or weather is less than ideal, corn prices will continue their upward spiral. This figure is from Feed Outlook, FDS-11b, Economic Research Service, February 11, 2011.


