
U.S. agricultural imports have grown significantly over last quarter century
- by Adam Gerval
- 8/31/2020
Errata: On September 4, 2020, this chart was reposted to correct a unit error in the y-axis label.
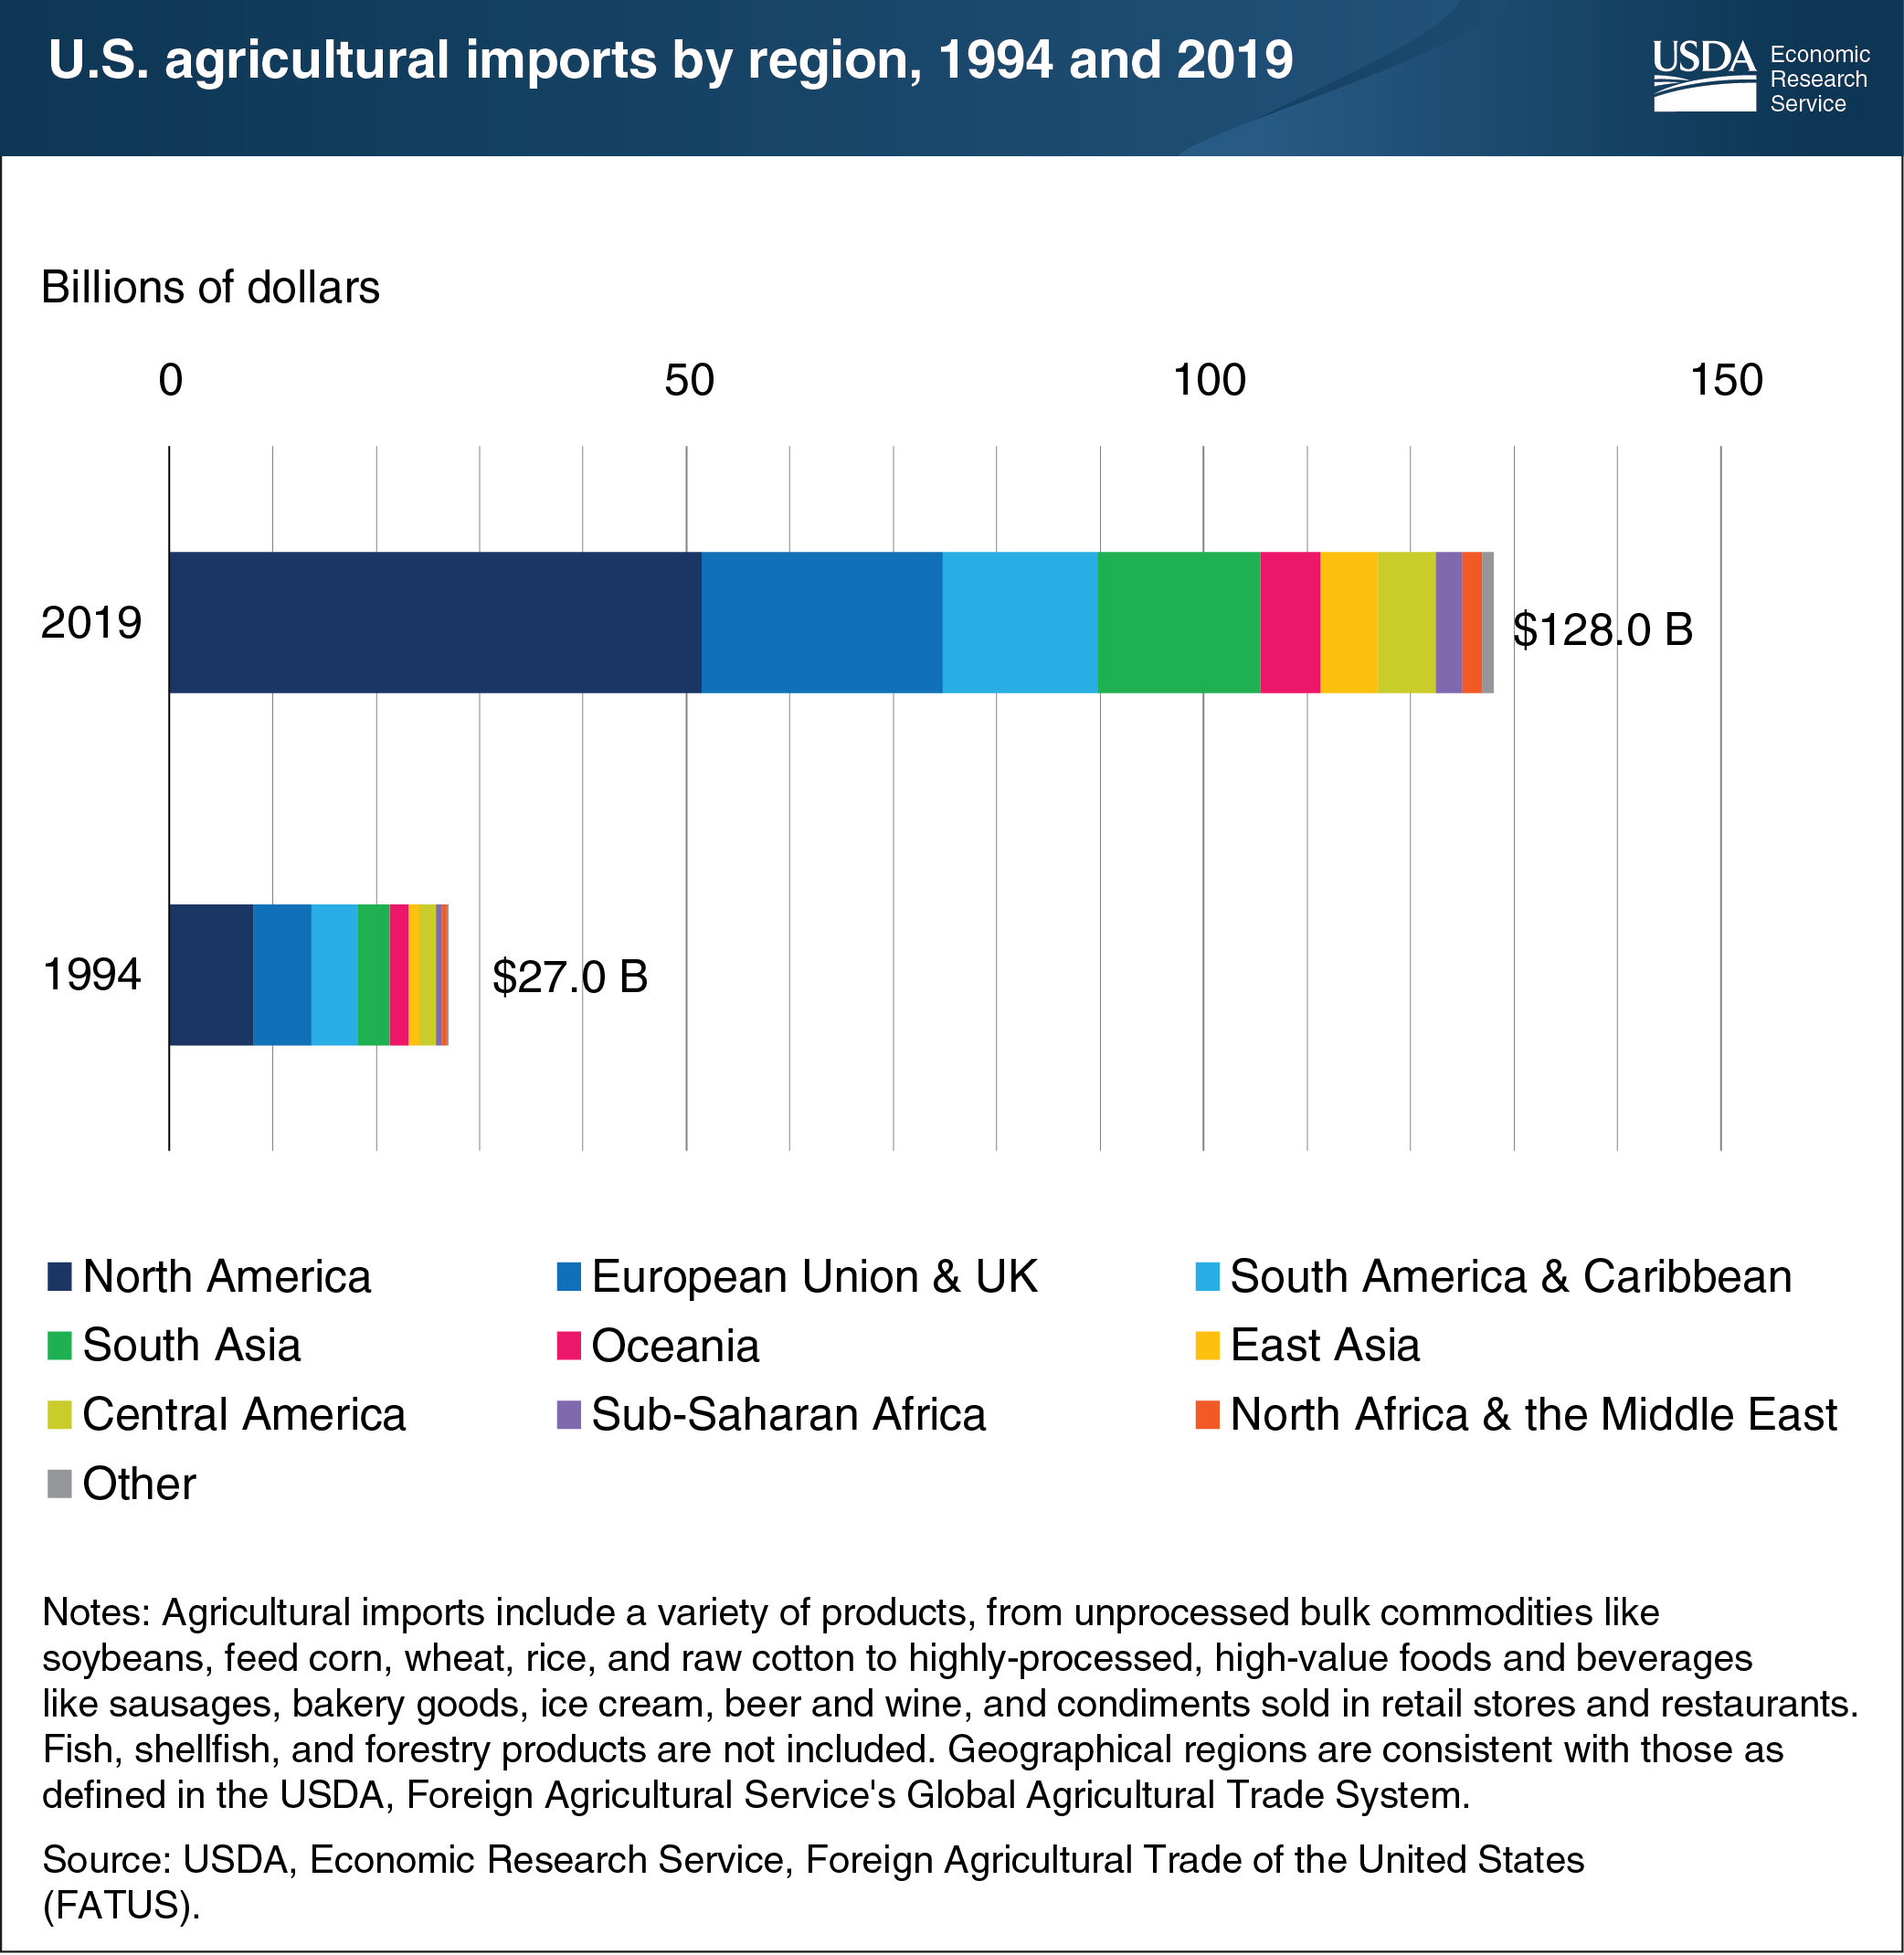
Over the last quarter century, the United States has become one of the largest agricultural importers in the world. During this time, imports have grown significantly from $27 billion in 1994 to $128 billion in 2019. The role of the North American Free Trade Agreement (NAFTA) in 1994—superseded by the United States-Mexico-Canada Agreement (USMCA) in July 2020—has played a central role in this surge, with U.S. imports from the North American region increasing more than six-fold from $8.2 billion in 1994 to $52 billion in 2019. The volume of imports from all regions has risen across all commodities, but consumer-oriented products, such as fresh fruits and vegetables, beef products, and wine and beer products have led the increase. Even as overall imports have grown, imports from Europe, as well as South America and the Caribbean, have dipped, reflecting the decreasing share of berries and other fruits provided by these countries, as well as additional sources of alcoholic beverages imported from USMCA trading partners. These charts are drawn from the Economic Research Service product, U.S. Agricultural Trade at a Glance.