
U.S. food spending in June 2020 was $12 billion less than in June 2019
- by Eliana Zeballos and Wilson Sinclair
- 8/28/2020
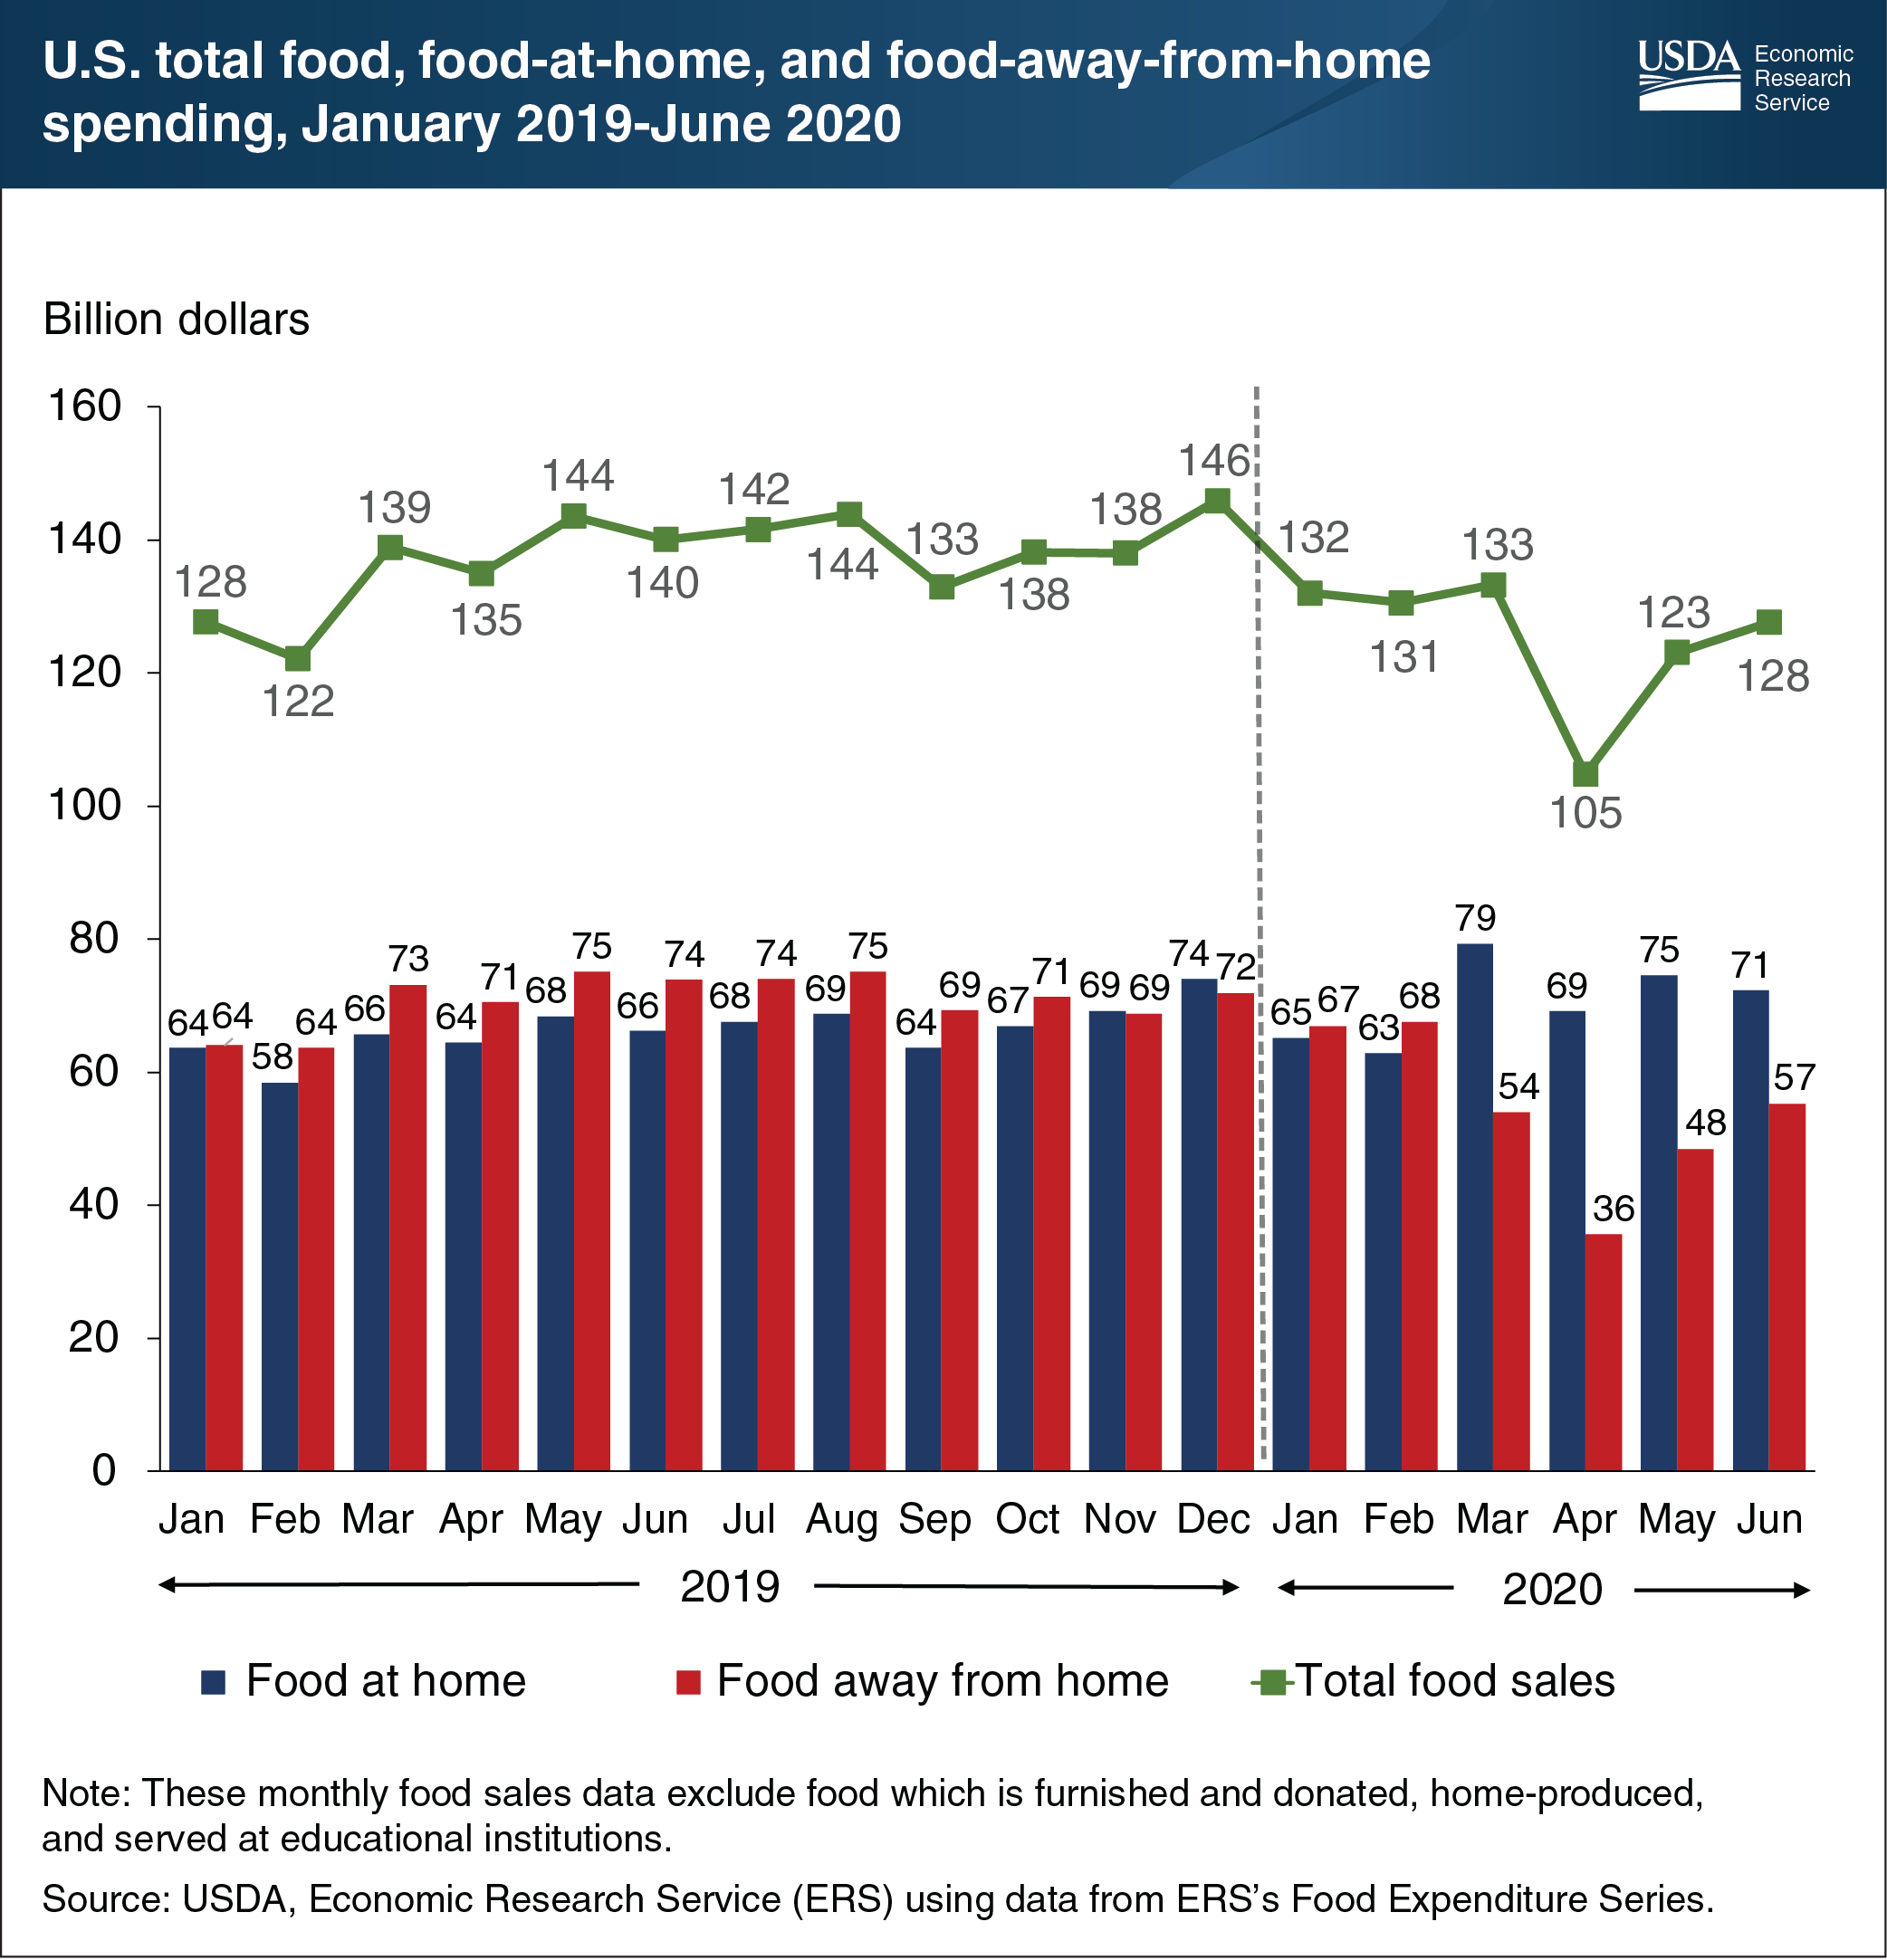
In 2019, before the COVID-19 pandemic, U.S. consumers, businesses, and government entities spent an average of $137.4 billion per month on food. Normal seasonal variations were present, with total food spending being lowest in January and February and highest in May, August, and December. Early 2020 followed the same pattern, with lower-than-average total food spending in January and February, but this trend continued into the spring with spending on food falling to $105 billion in April 2020, as spending at food-away-from-home establishments—restaurants, school cafeterias, sports venues, and other eating places—dropped to $36 billion. Spending on food-away-from-home rebounded in May and June but remained below 2019 spending in those months. Total food sales rose in May and June 2020 but were still lower than a year ago. Higher monthly sales at grocery stores, supercenters, convenience stores, and other food-at-home retailers compared with last year were not enough to compensate for the lower spending at food-away-from-home establishments. The data in this chart, along with more information on U.S. food sales and expenditures, can be found in the Economic Research Service’s Food Expenditure Series data product, updated August 20, 2020.