
Forecast for higher solvency ratios in 2020 indicates that more of the farm sector’s assets are financed by credit or debt
- by Carrie Litkowski
- 4/27/2020
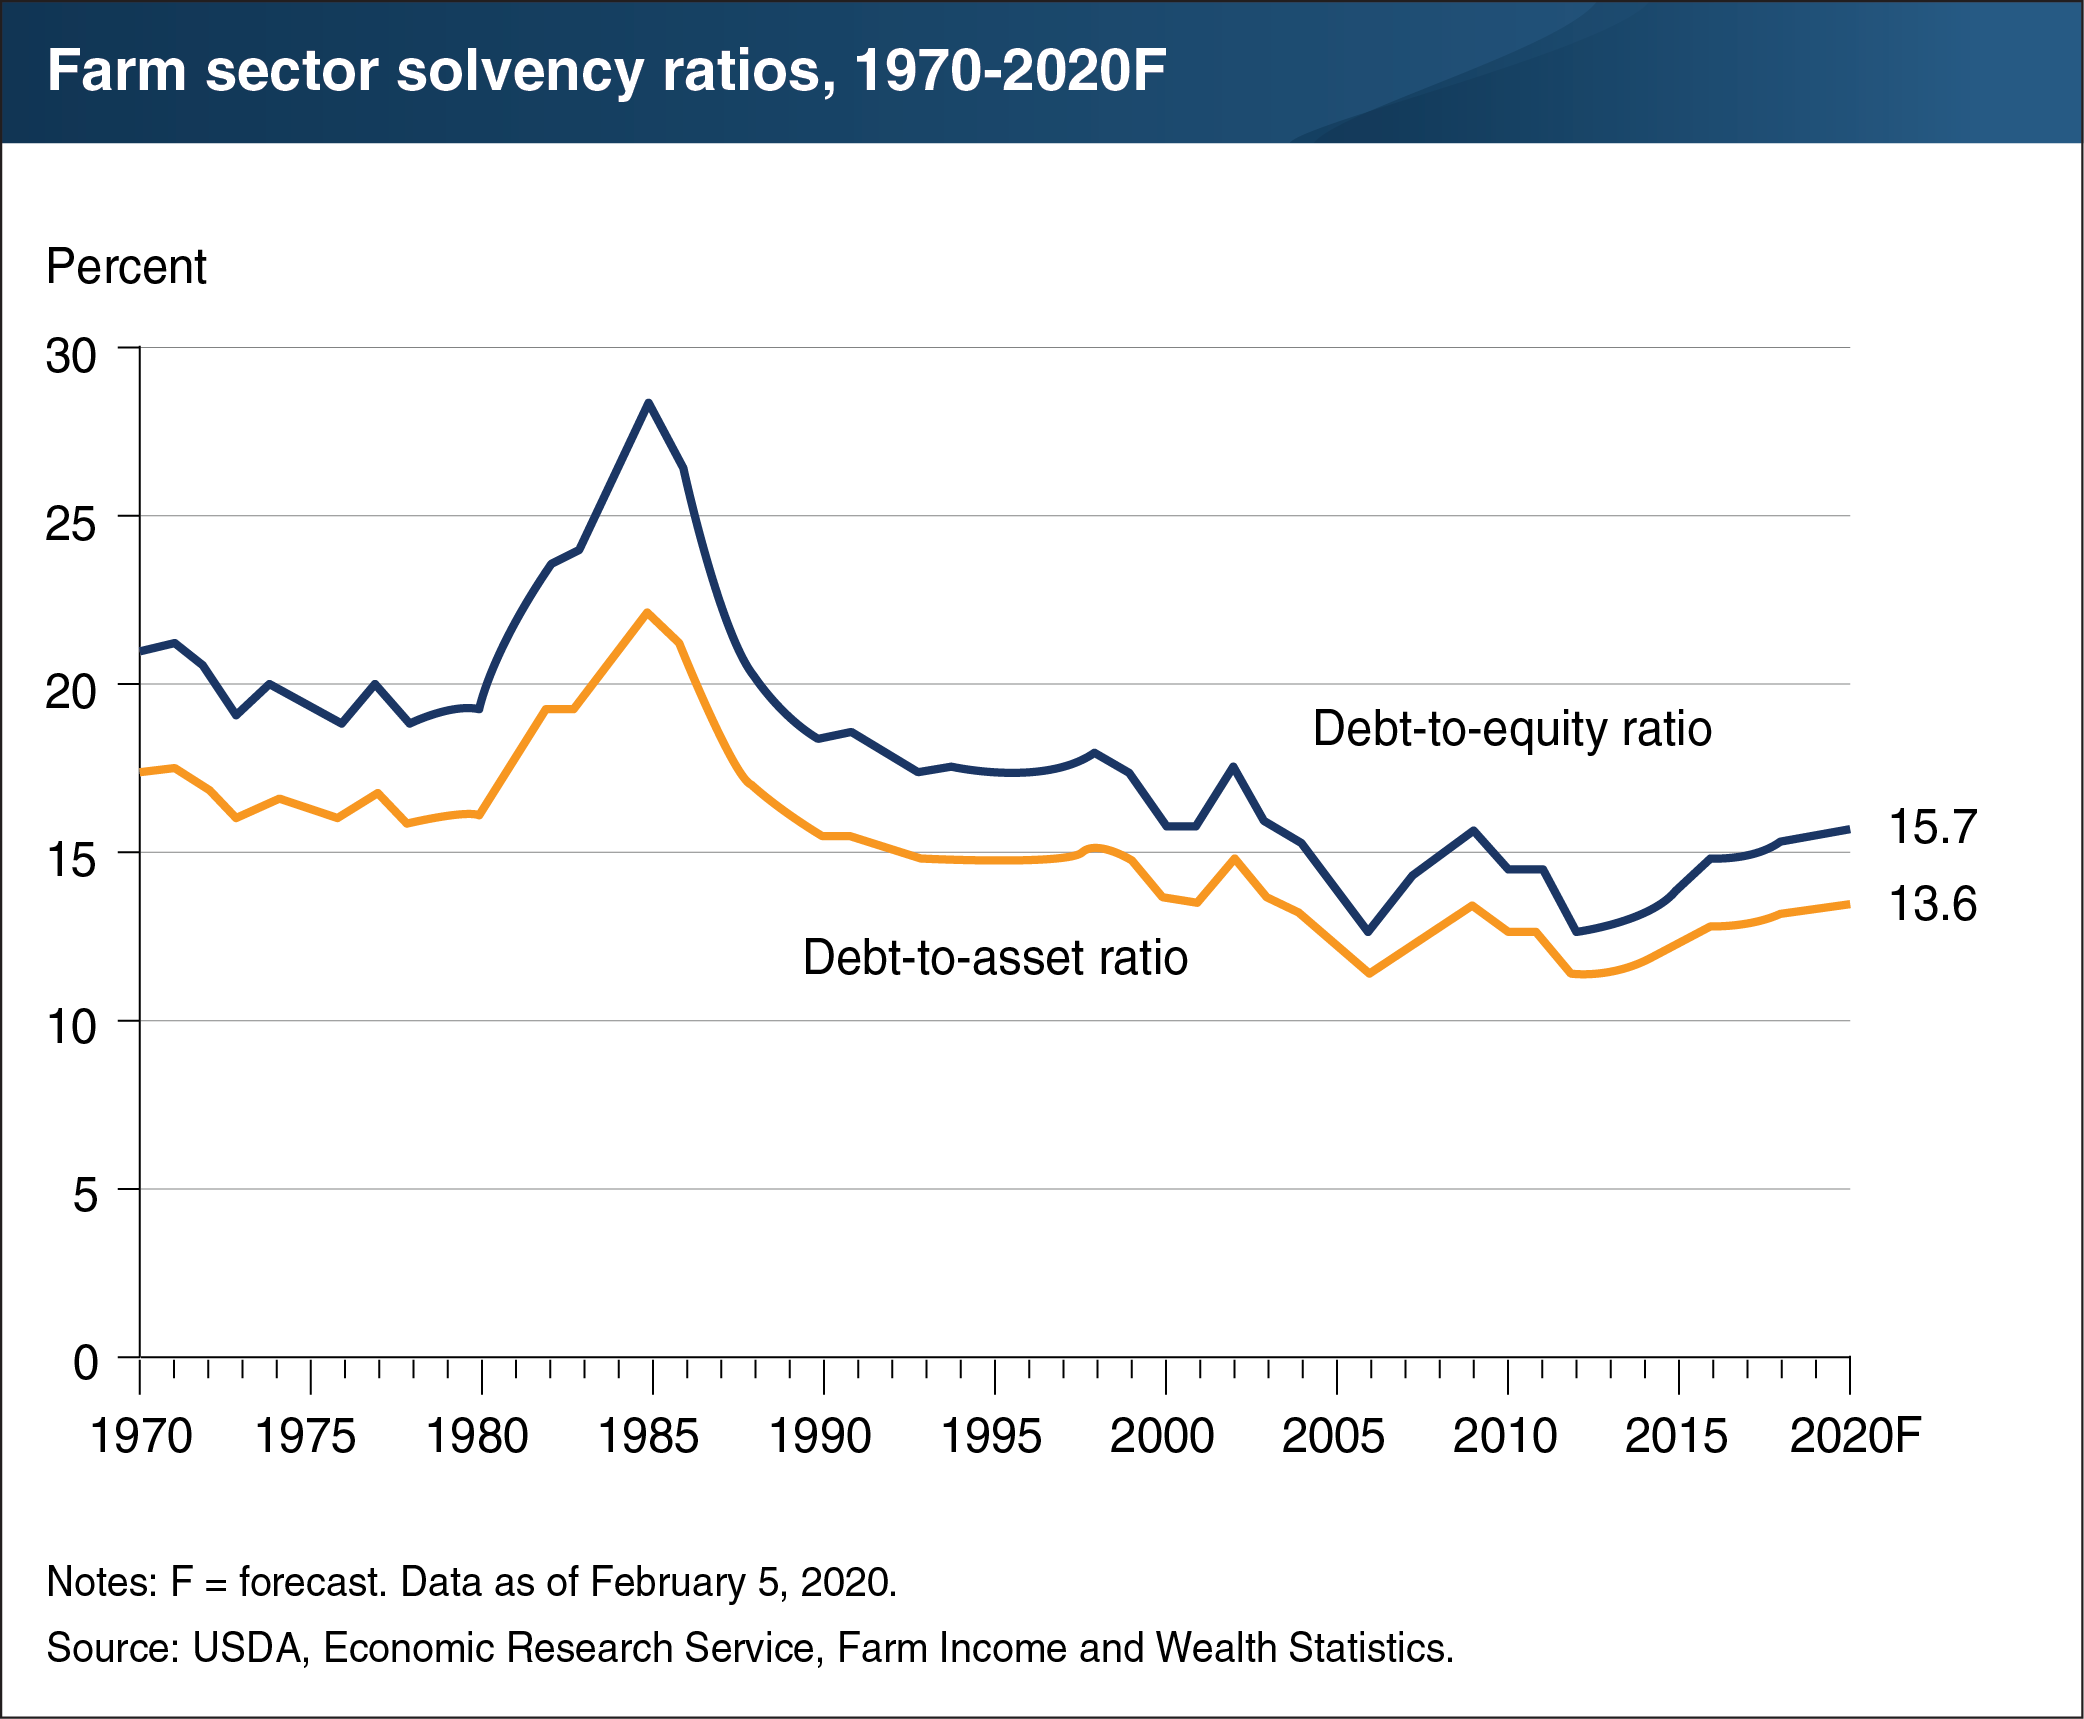
Solvency is a measure of the ability of a farm or ranch operation to satisfy its debt obligations when due. Popular measures of solvency include the debt-to-equity ratio, debt-to-asset ratio, and equity-to-asset ratio. Solvency ratios compare the amount of debt relative to equity invested in the farm sector. As a result, these ratios provide a measure of the farm sector’s ability to repay financial liabilities via the sale of assets. The ratios also measure the farm sector’s risk exposure and ability to overcome adverse financial events. The farm sector debt-to-equity and debt-to-asset ratios are expected to continue their slow increases from 2012. The Economic Research Service (ERS) forecasts a debt-to-equity ratio of 15.7 percent in 2020, and a debt-to-asset ratio of 13.6 percent. These higher ratios indicate that more of the farm sector’s assets are financed by credit or debt relative to owner capital (equity). This is the result of farm sector debt growing at a faster rate than farm sector assets. The impact of this year’s shelter-in-place restrictions due to COVID-19 are not reflected in this ERS data. This chart appears in the ERS topic page for Farm Sector Income and Finances.