
About a third of beginning farms and half of established farms produced at least $10,000 worth of output between 2013 and 2017
- by Nigel Key
- 1/31/2020
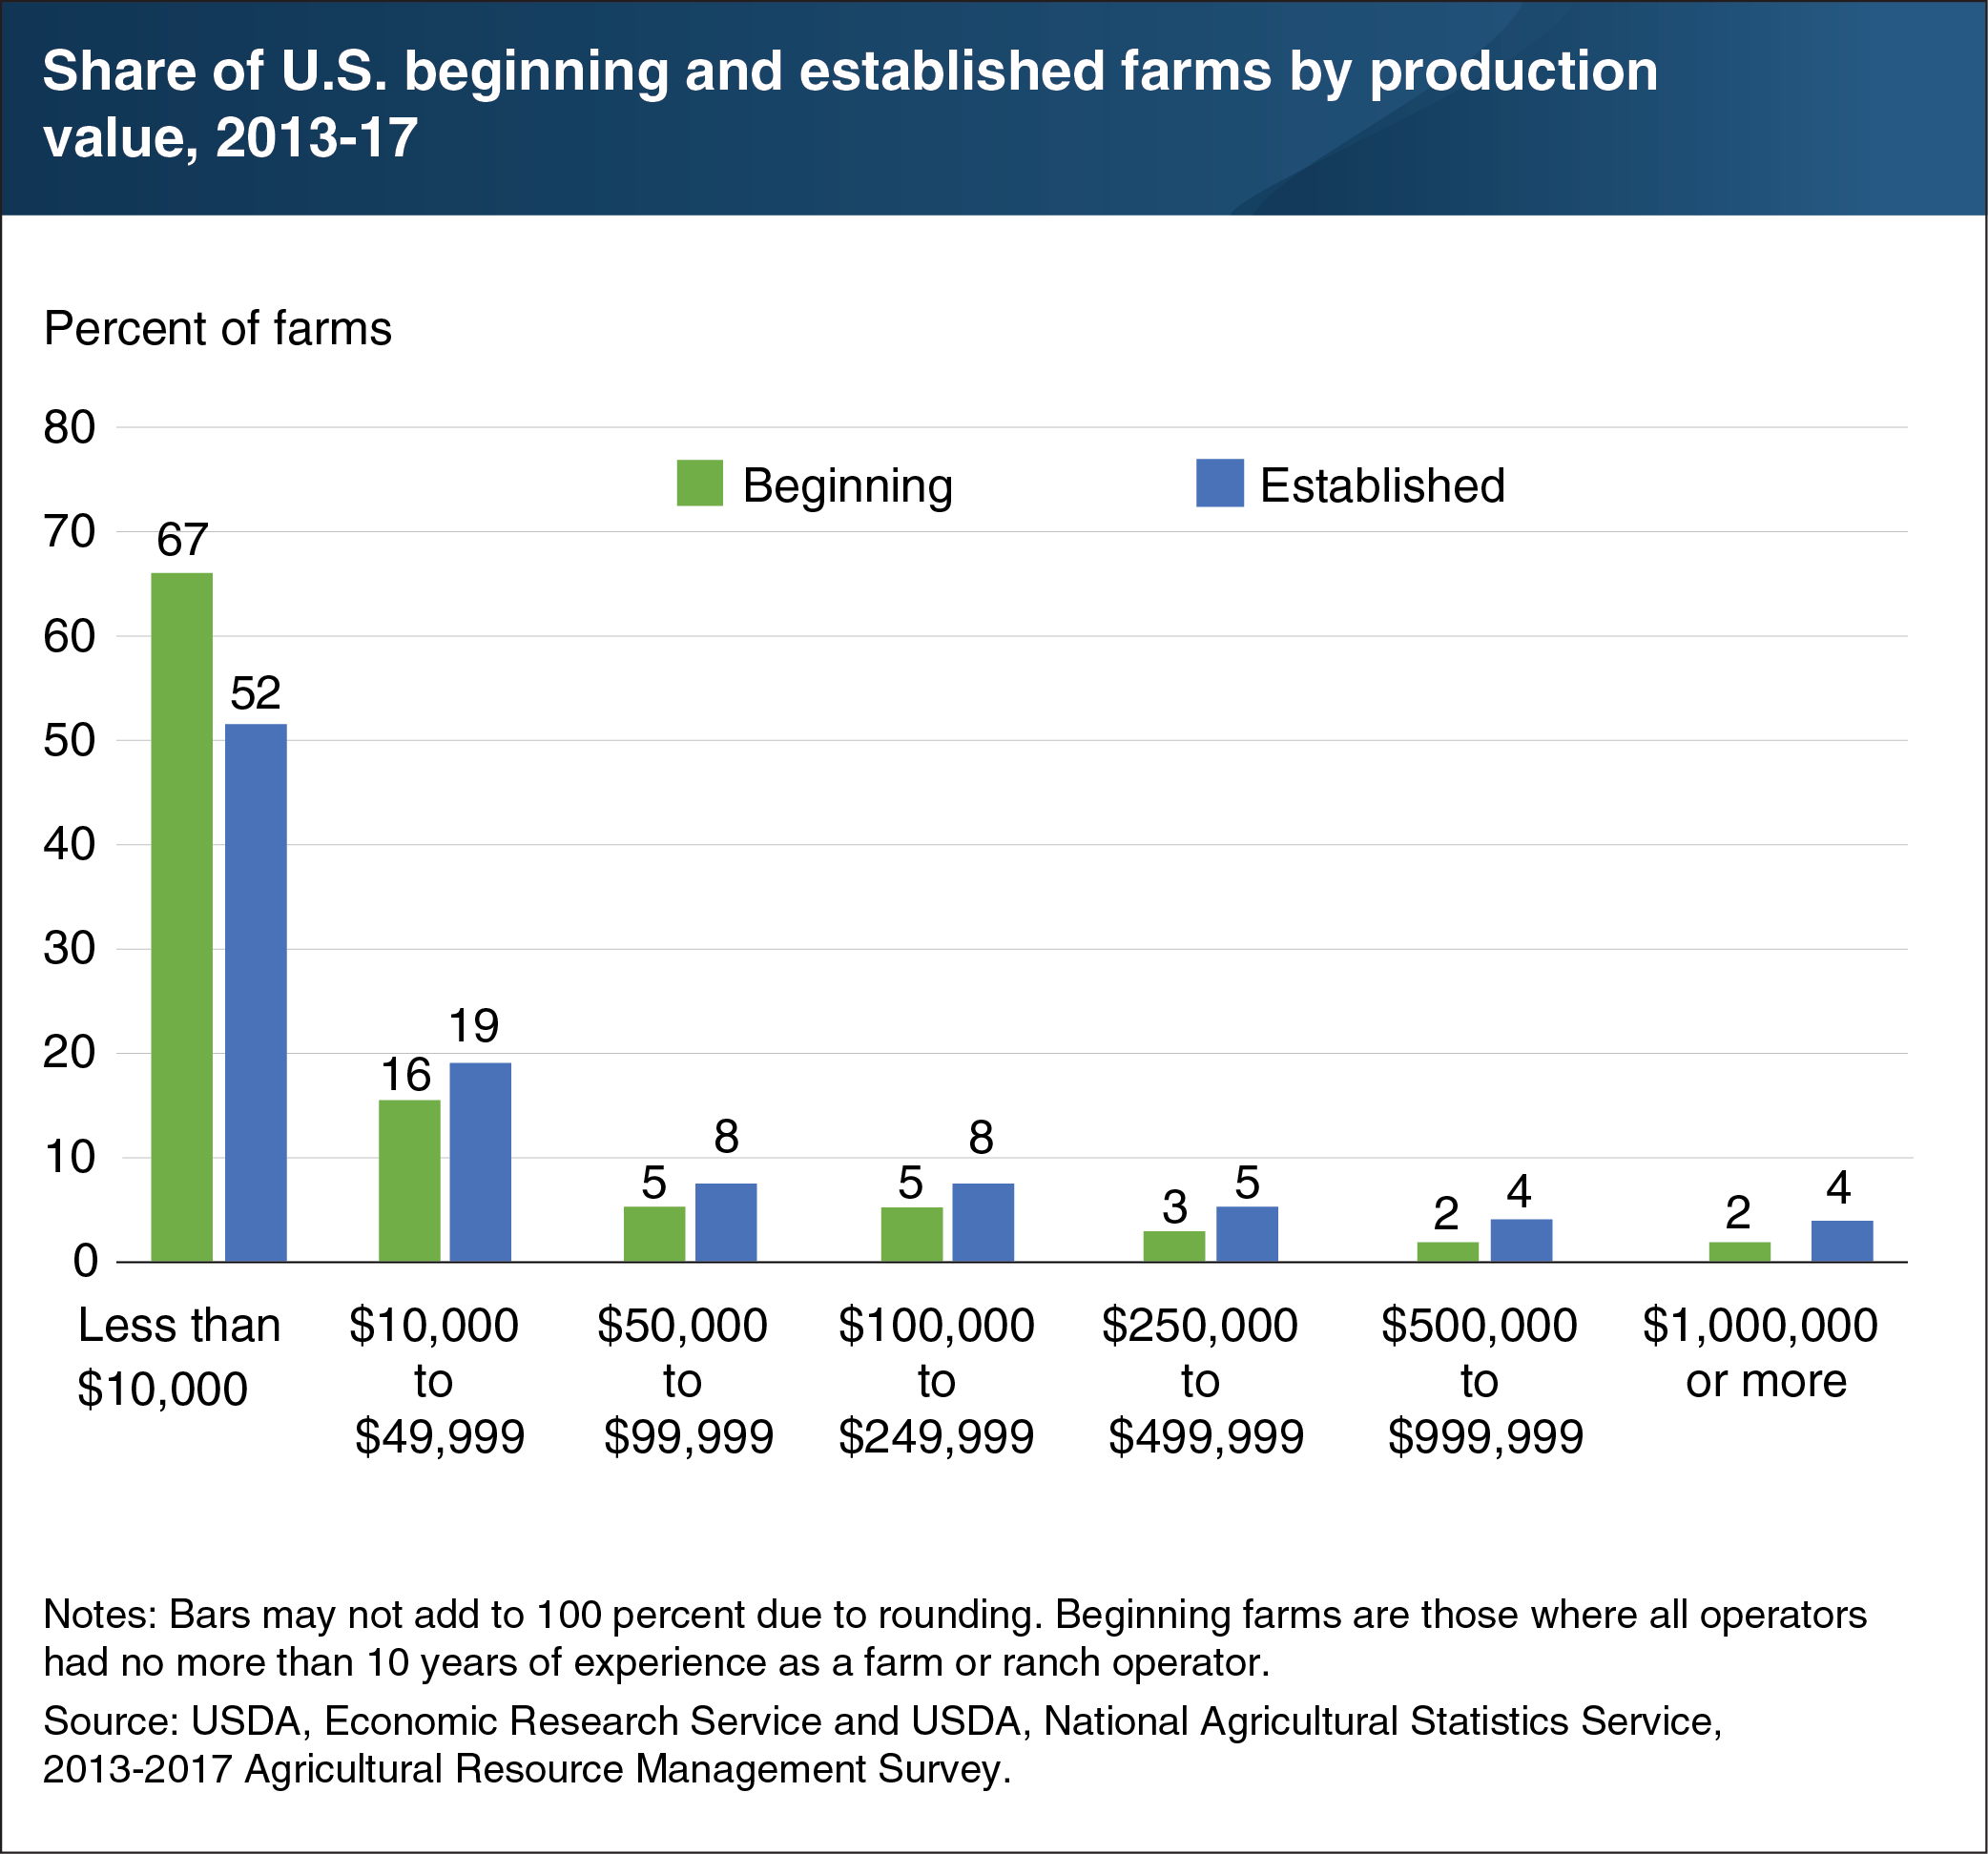
From 2013 to 2017, there were an average of 898,100 operators with no more than 10 years of farming experience. Of these beginning farmers, a little more than half (461,400) were operators of beginning farms, or those farms on which all the operators were beginning farmers. Overall, there were an average of 339,400 beginning farms and 1,691,400 established farms between 2013 and 2017. About a third of beginning farms and half of established farms produced at least $10,000 worth of output. Beginning farms (67 percent) were also more likely than established farms (52 percent) to be very small, generating less than $10,000 worth of output. Although the majority of beginning and established farms were very small, these operations contributed a relatively low share of production—accounting for about 2 percent of output from all beginning farms and 1 percent from all established farms. This chart appears in the ERS report, An Overview of Beginning Farms and Farmers, released September 2019.