
Contracts governed one-third of the value of agricultural production in 2017, with a concentration in livestock
- by James M. MacDonald
- 7/12/2019
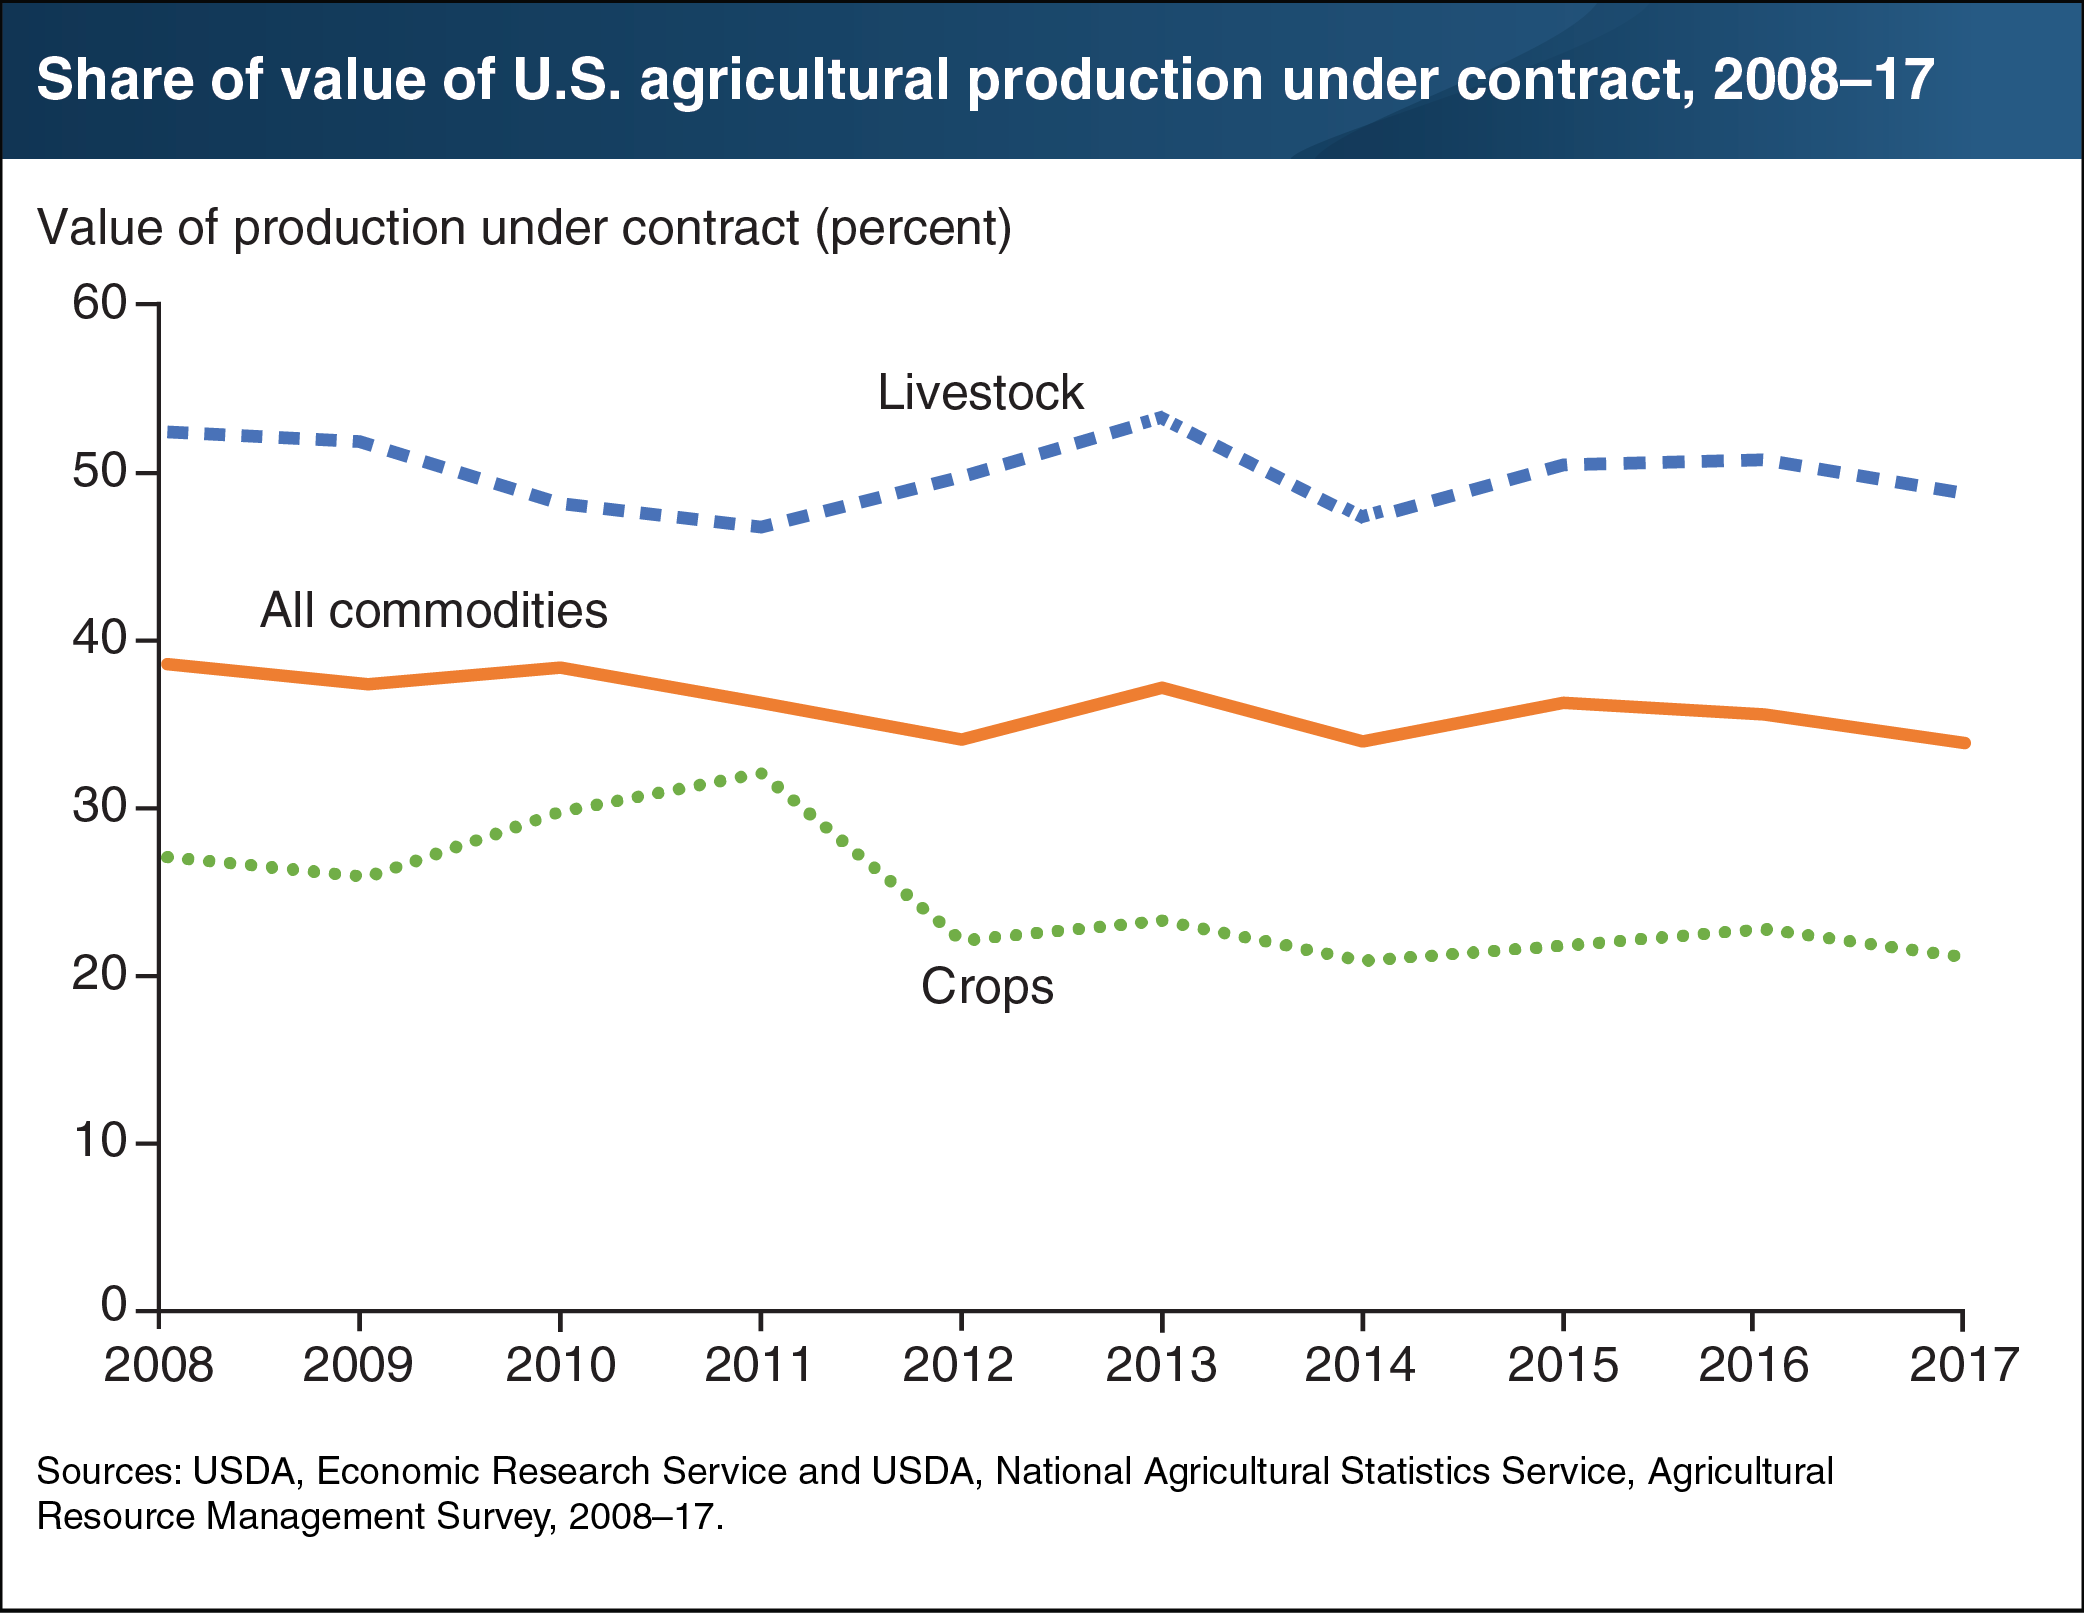
Contracts are widely used in the production and sale of U.S agricultural commodities. Contracts provide farmers with a tool for managing income risks. Farmers also use contracts to obtain compensation for higher product quality, specify outlets for products, and provide assurance of sales for debt financing. Processors use contracts to ensure timely flows of inputs and greater control over the characteristics and consistency of the products they acquire. In 2017, 49 percent of livestock were raised under contract agreements—usually between farmers and processors—while contracts governed 21 percent of crop production. The share of crops produced under contract has declined in recent years as farmers turned to other methods for managing risks, such as diversification, hedging through futures markets, and investing in storage. This chart appears in the December 2018 report America’s Diverse Family Farms: 2018 Edition and the July Data Feature of the ERS Amber Waves magazine, “Marketing and Production Contracts Are Widely Used in U.S. Agriculture.”