
Economies of size possible for rice farms in the Southern United States
- by William D. McBride
- 2/20/2019
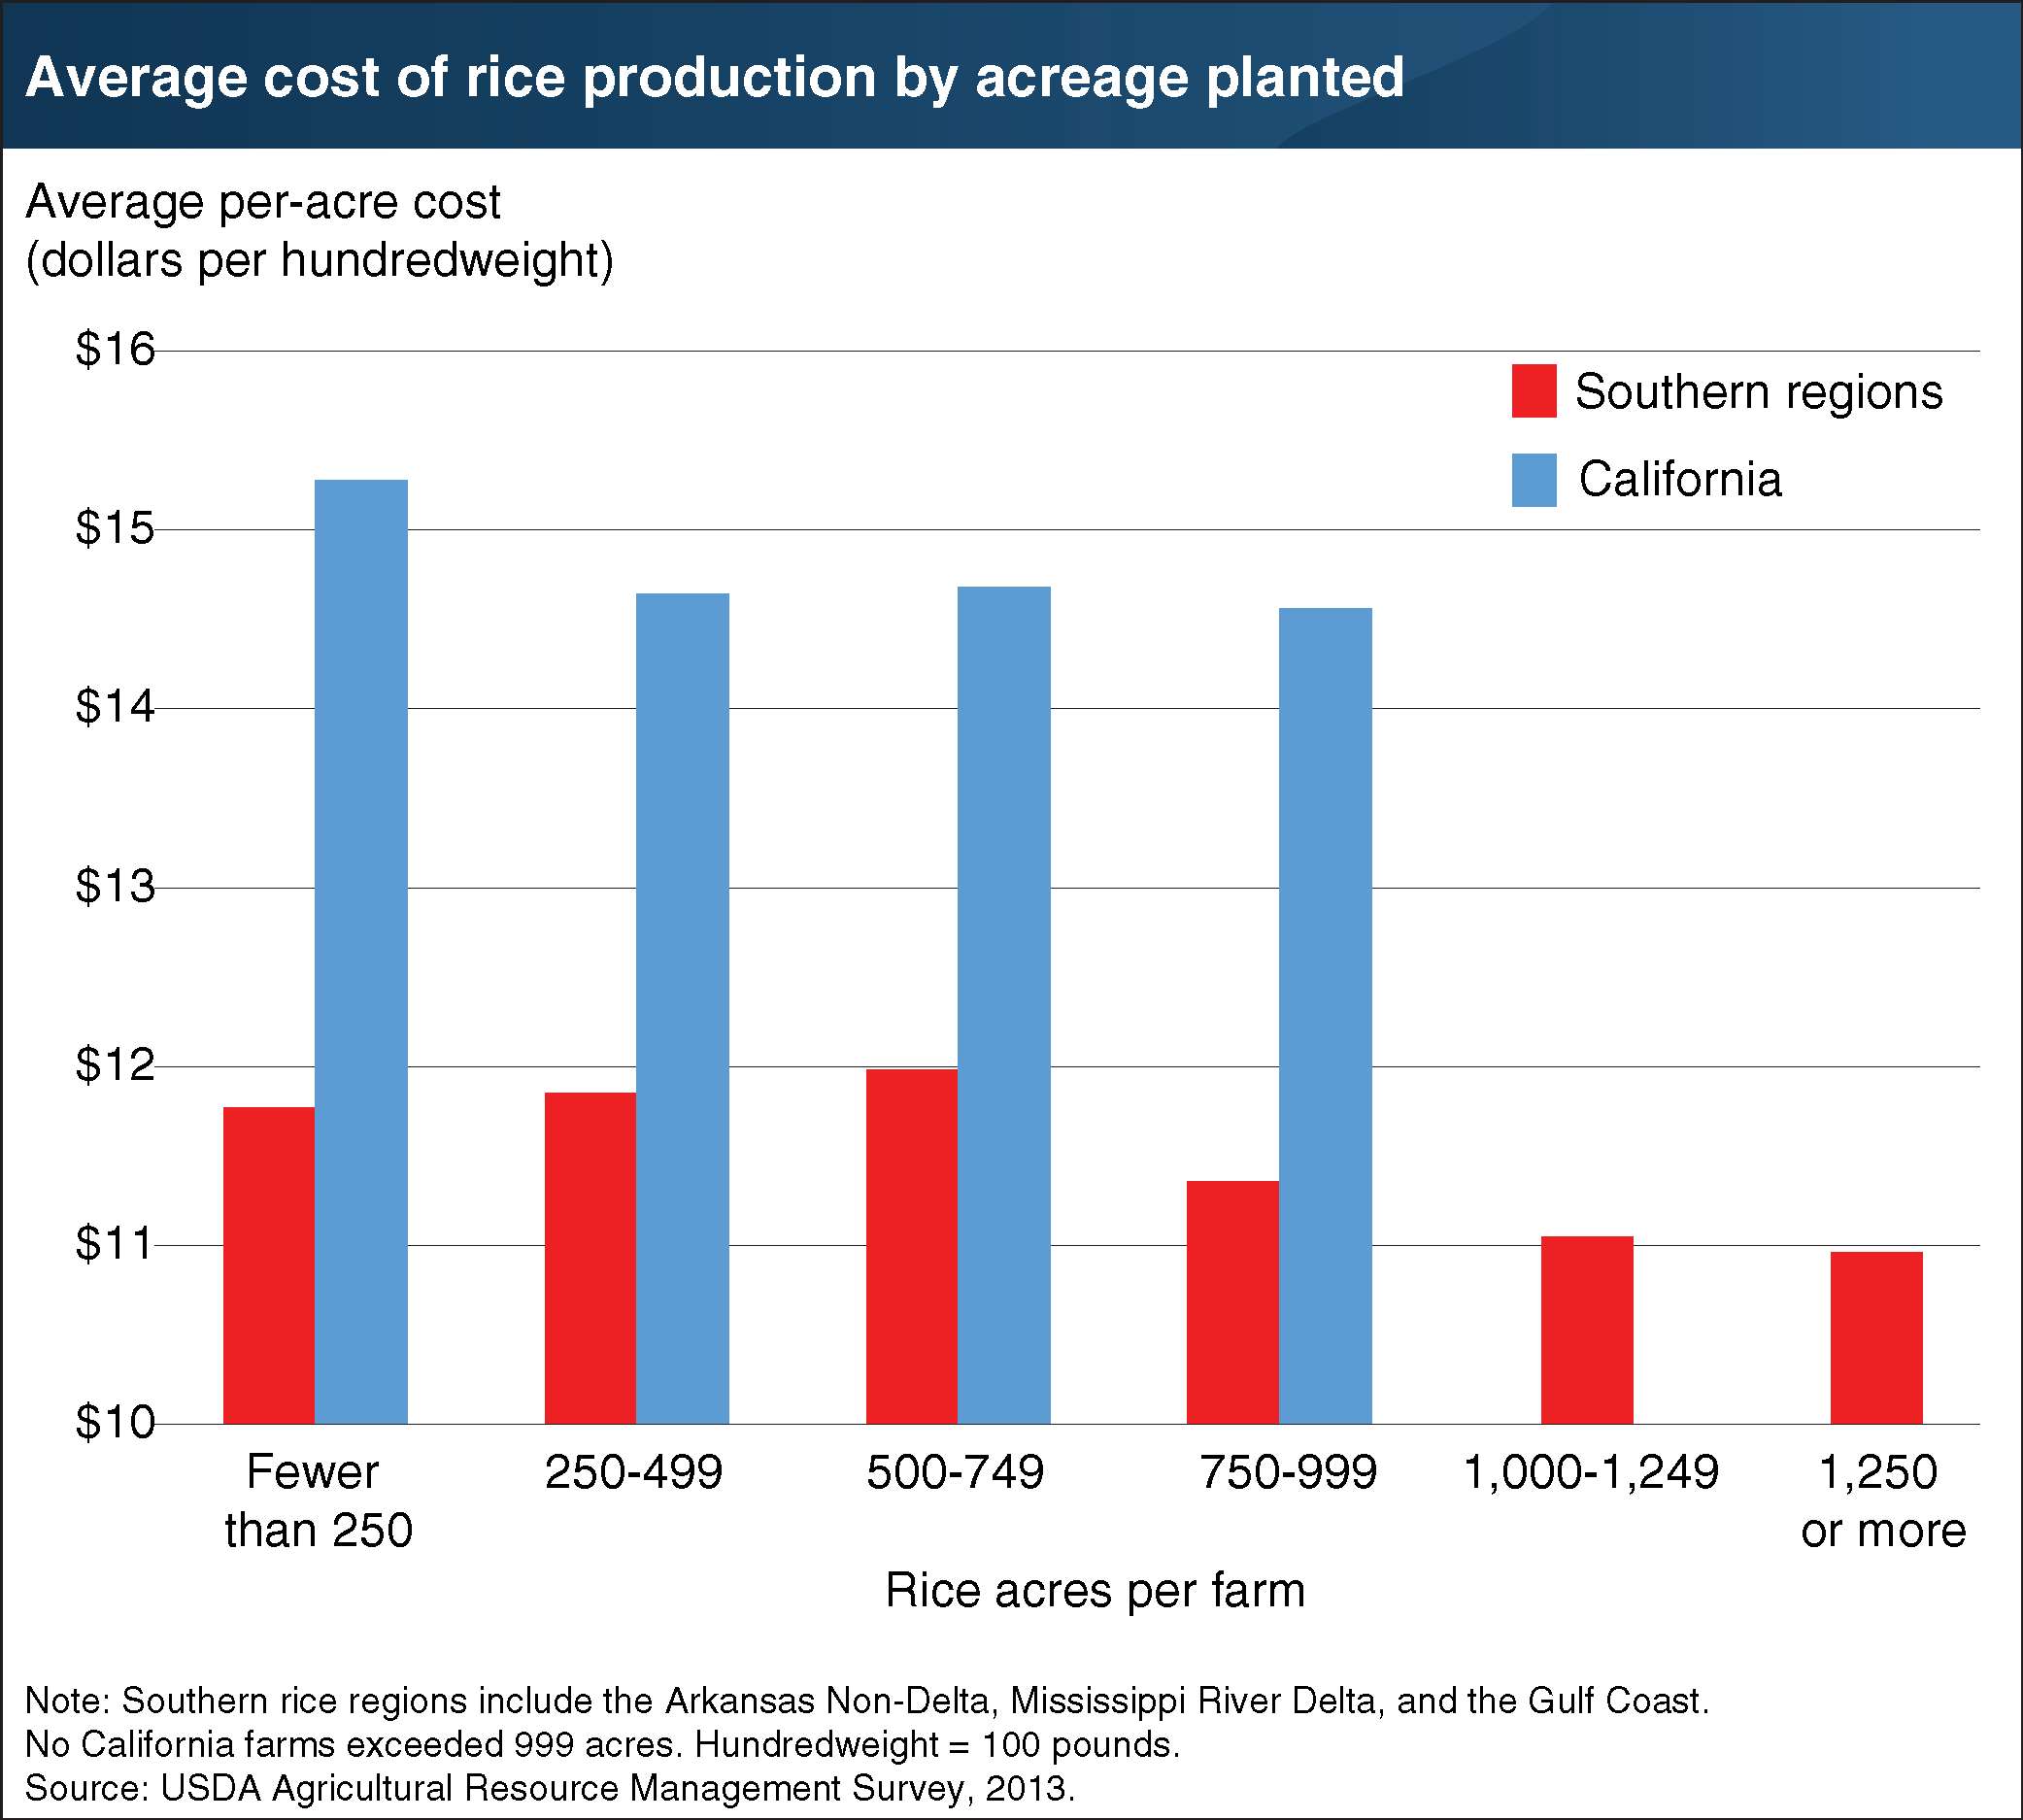
Economies of size exist in crop production if unit costs decline as per-farm crop acreage increases. The existence of economies of size is a driving force behind changes in operation size and farm productivity. Using data from 2013, rice costs per hundredweight (cwt) were summarized for size groups indicated by the number of rice acres per farm in California and in Southern U.S. rice-growing regions. In California, where rice production costs are higher than in the South, nearly all economies of size were achieved on farms with 250-499 rice acres. Farms with 250-499 acres had production costs that were 4.2 percent less than those of farms with fewer than 250 acres. However, average unit costs for rice production on California farms did not decline much more on larger farms. In the South, production costs per cwt were much the same for operations in size groups with less than 750 rice acres. However, economies of size were present for operation sizes greater than 750 rice acres. Higher cost savings on larger farms in the South suggest that the potential to further exploit economies of size is much greater than that among California farms. This chart appears in the ERS report U.S. Rice Production in the New Millennium: Changes in Structure, Practices, and Costs, released in December 2018.