
Income sources vary among SNAP households with different compositions
- by Laura Tiehen
- 10/2/2018
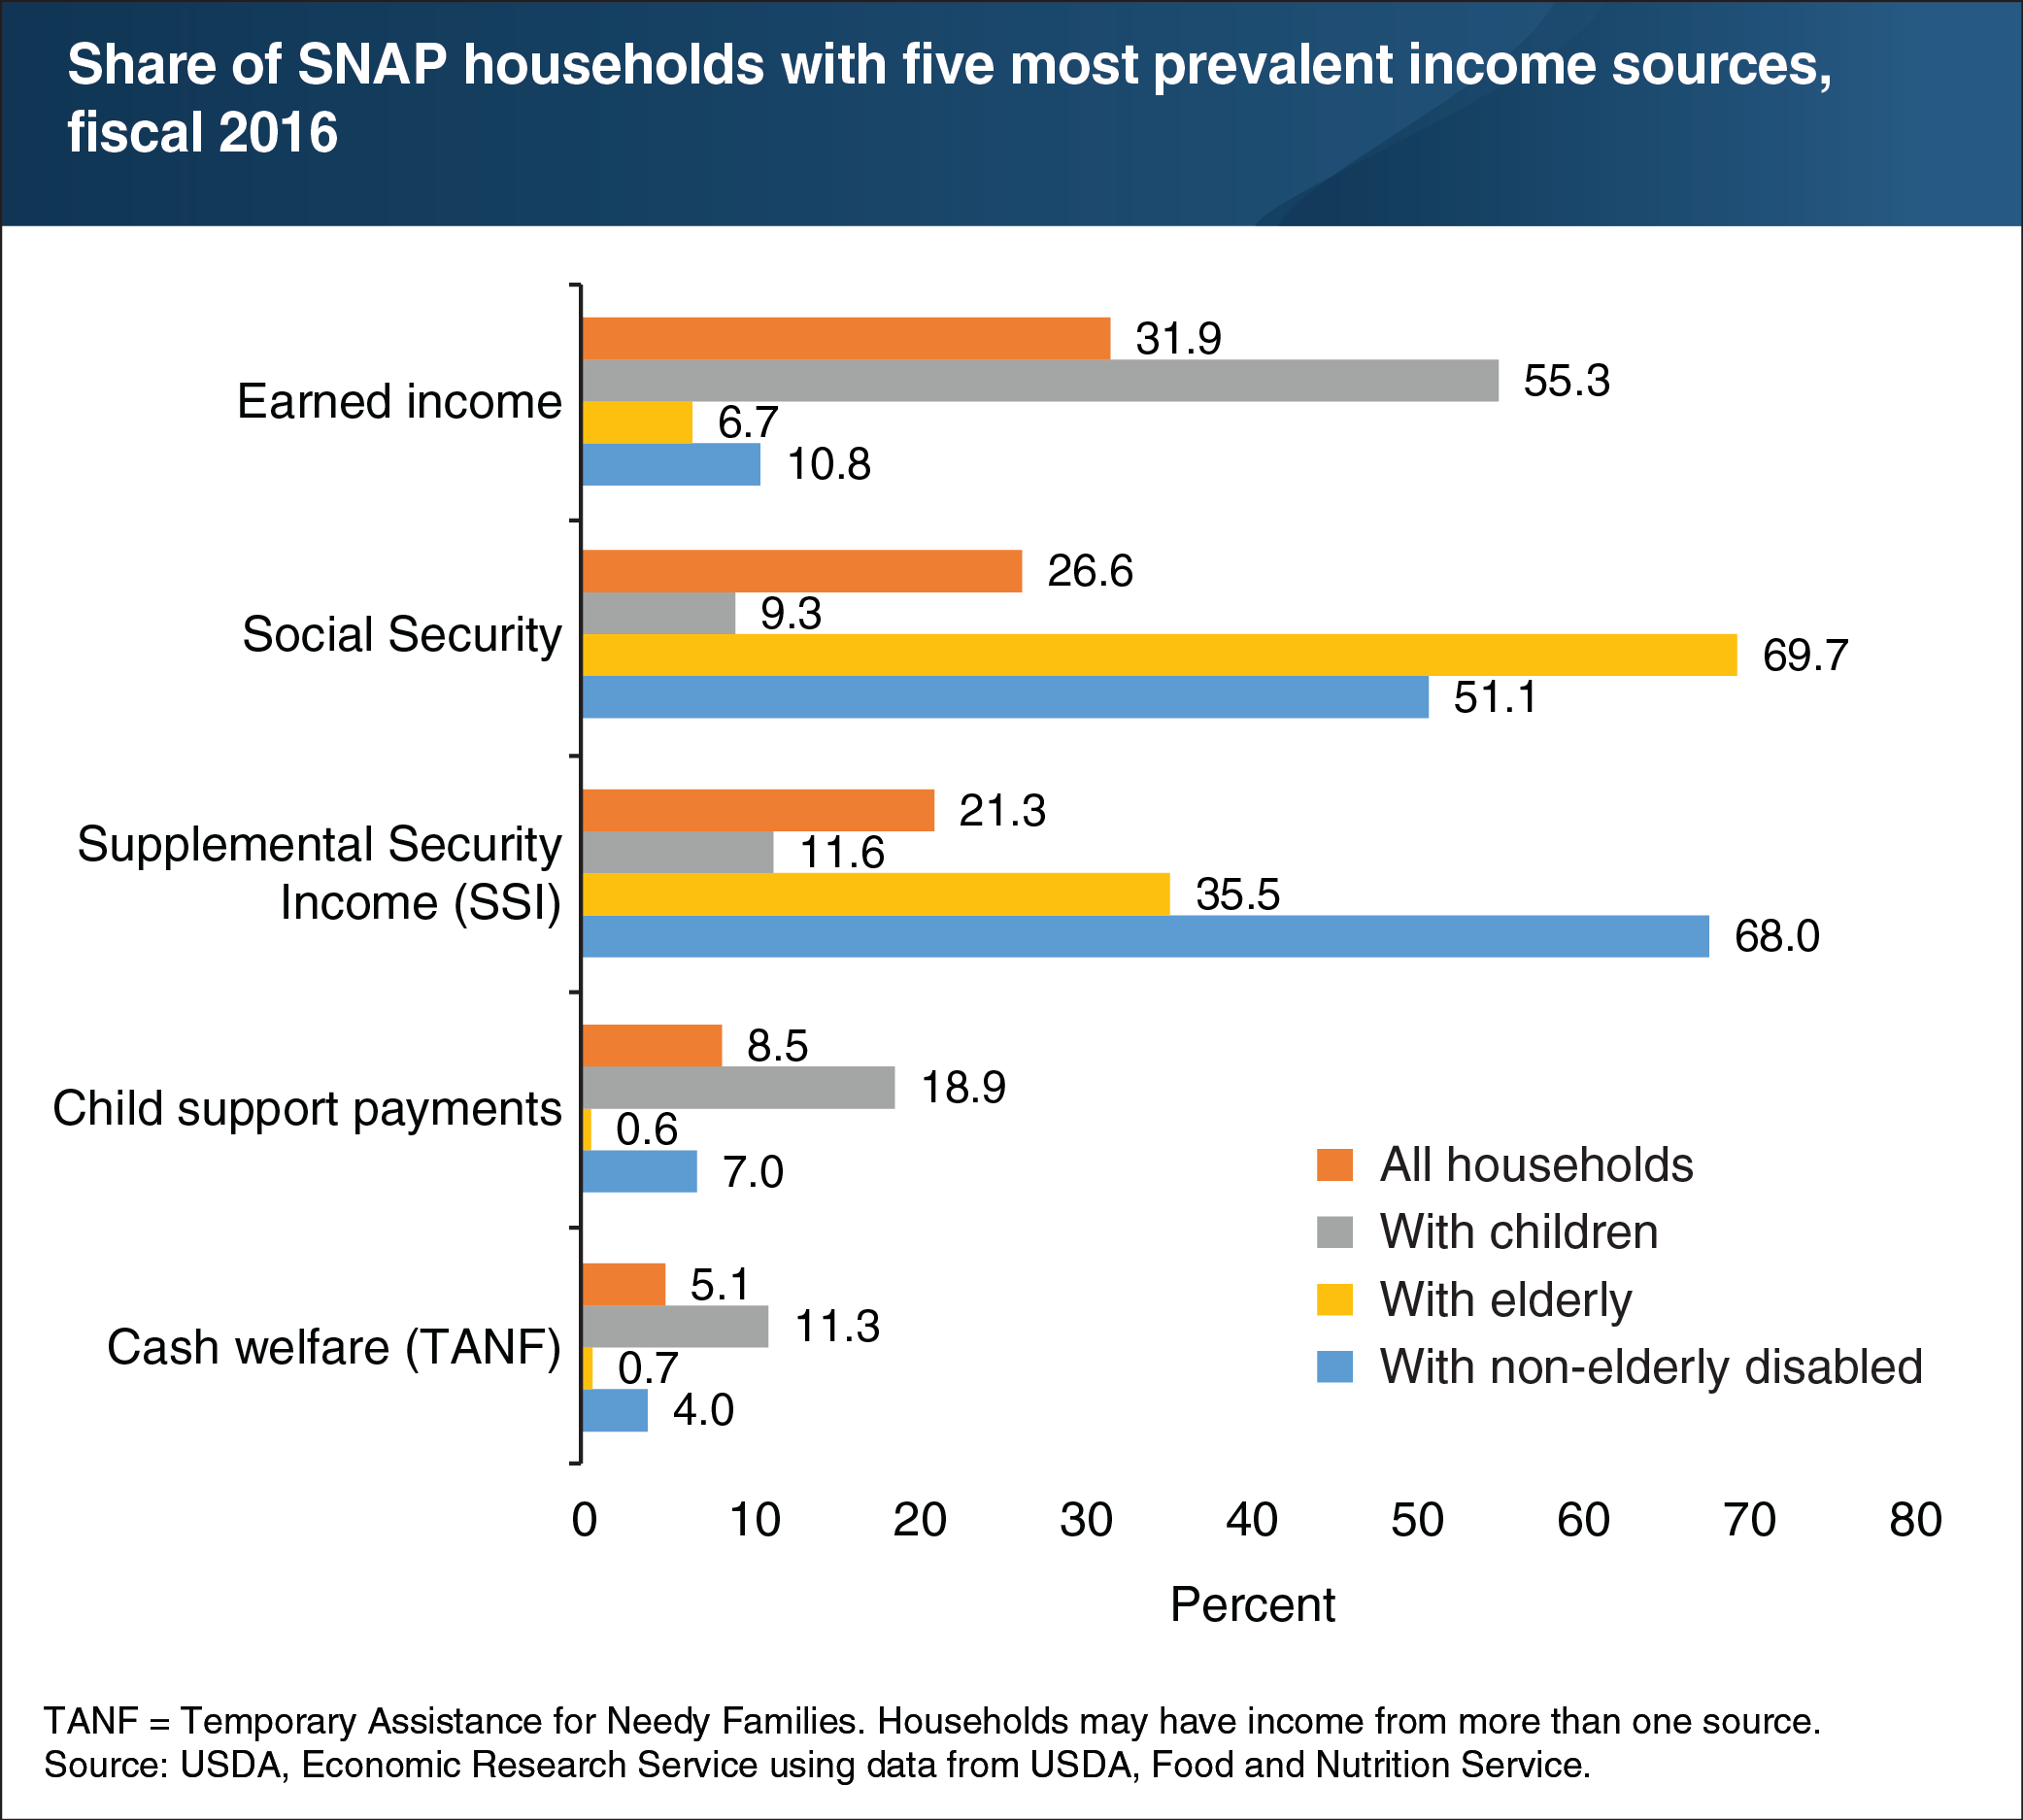
In a typical month in fiscal 2017, USDA’s Supplemental Nutrition Assistance Program (SNAP) provided average monthly benefits of $126 per person to 42.1 million low-income people living in 20.9 million households. SNAP households report receiving income from a variety of sources. The most prevalent income source is earnings, which were received by 32 percent of SNAP households in fiscal 2016. Social Security benefits were received by 27 percent of all SNAP households and 70 percent of those with elderly members. Supplemental Security Income (SSI), a cash assistance program designed to help low-income non-elderly disabled and elderly people, was received by 21 percent of all SNAP households, 68 percent of SNAP households with non-elderly disabled members, and 36 percent of those with elderly members. Around 9 percent of all SNAP households and 19 percent of those with children received child support payments. In 2016, 5 percent of all SNAP households and 11 percent of those with children received cash assistance from Temporary Assistance for Needy Families (TANF). SNAP households may also receive non-cash assistance such as housing vouchers and free or low-cost health care coverage. This chart is from the Supplemental Nutrition Assistance Program (SNAP) topic page on the ERS website.