
Prevalence of food insecurity in 2017 was down from 2016
- by Christian A. Gregory, Alisha Coleman-Jensen and Matthew P. Rabbitt
- 9/6/2018
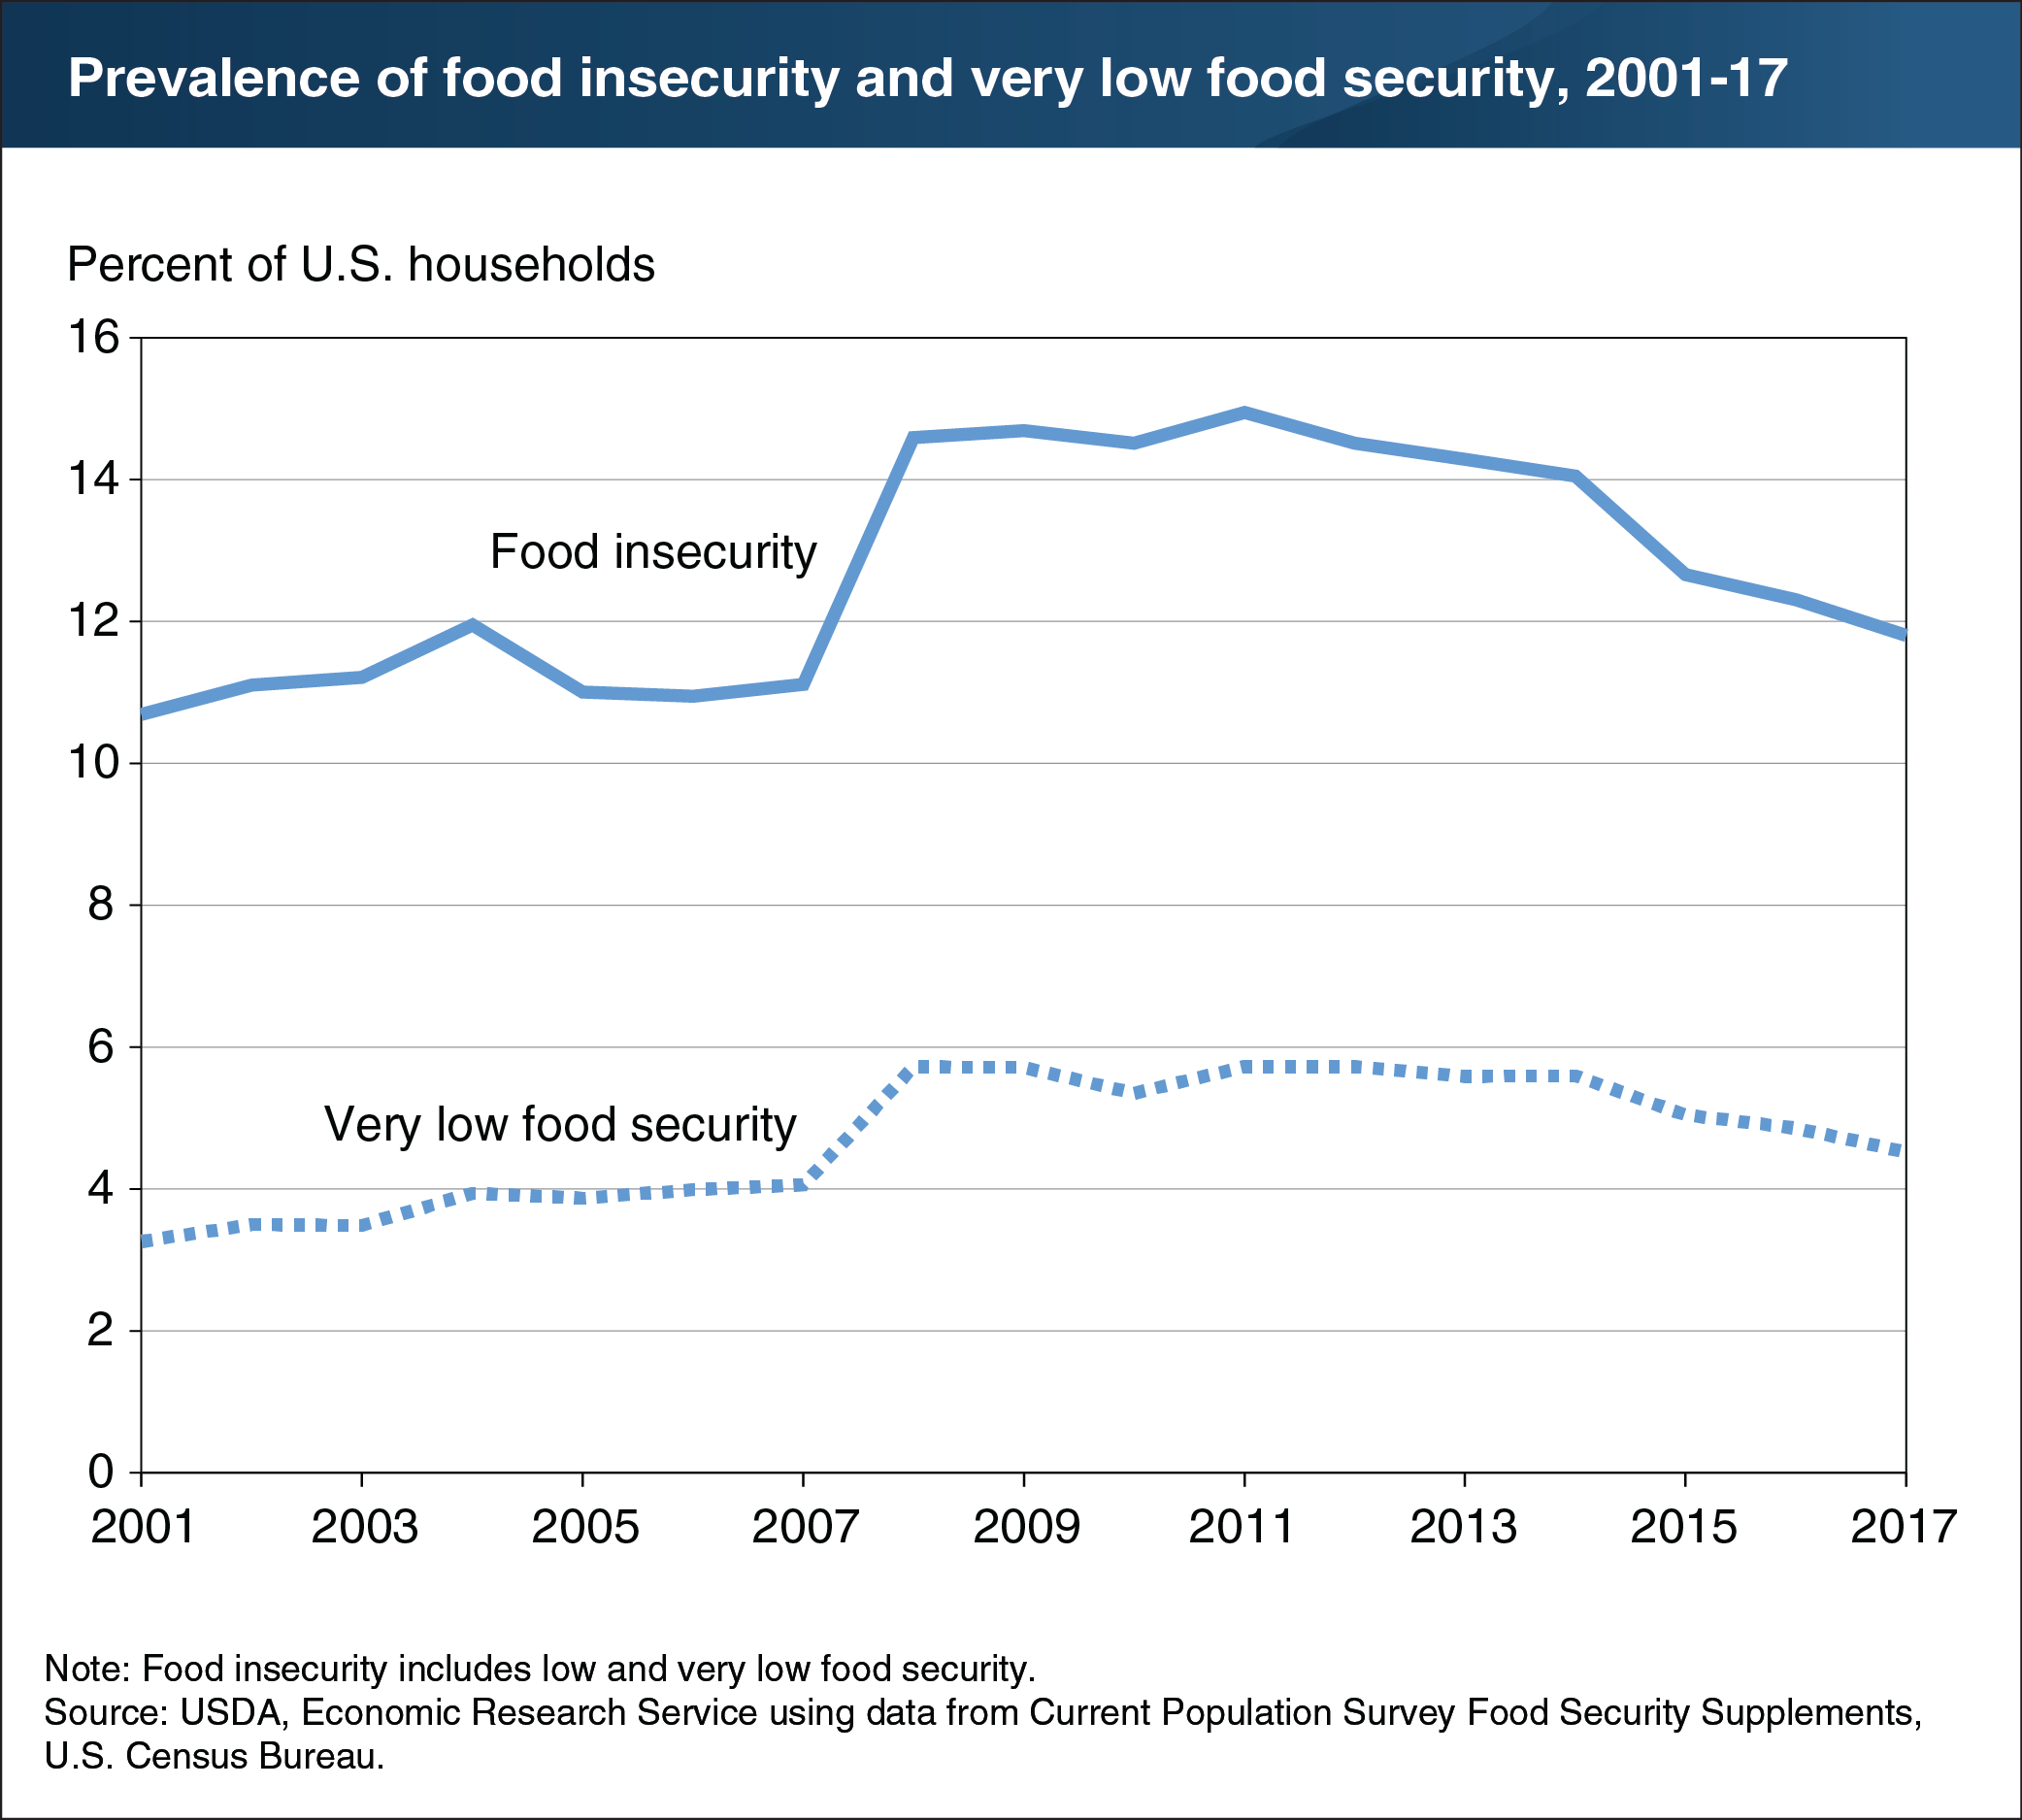
In 2017, 88.2 percent of American households were food secure throughout the year. The remaining households (11.8 percent) were food insecure, meaning they had difficulty at some time during the year providing enough food for all their members because of a lack of resources. The decline in food insecurity prevalence from 12.3 percent of U.S. households in 2016 is statistically significant. Over a third of food-insecure households (4.5 percent of U.S. households) experienced very low food security in 2017, meaning that at times the food intake of one or more household members was reduced and their eating patterns were disrupted because the household lacked money and other resources for food. The prevalence of very low food security was also significantly lower than in 2016, when it stood at 4.9 percent of U.S. households. This chart appears in the ERS report, Household Food Security in the United States in 2017, released September 5, 2018.