
Oil and gas payments accounted for about 30 percent of net cash farm income in Texas, Oklahoma, and Pennsylvania
- by Claudia Hitaj
- 7/27/2018
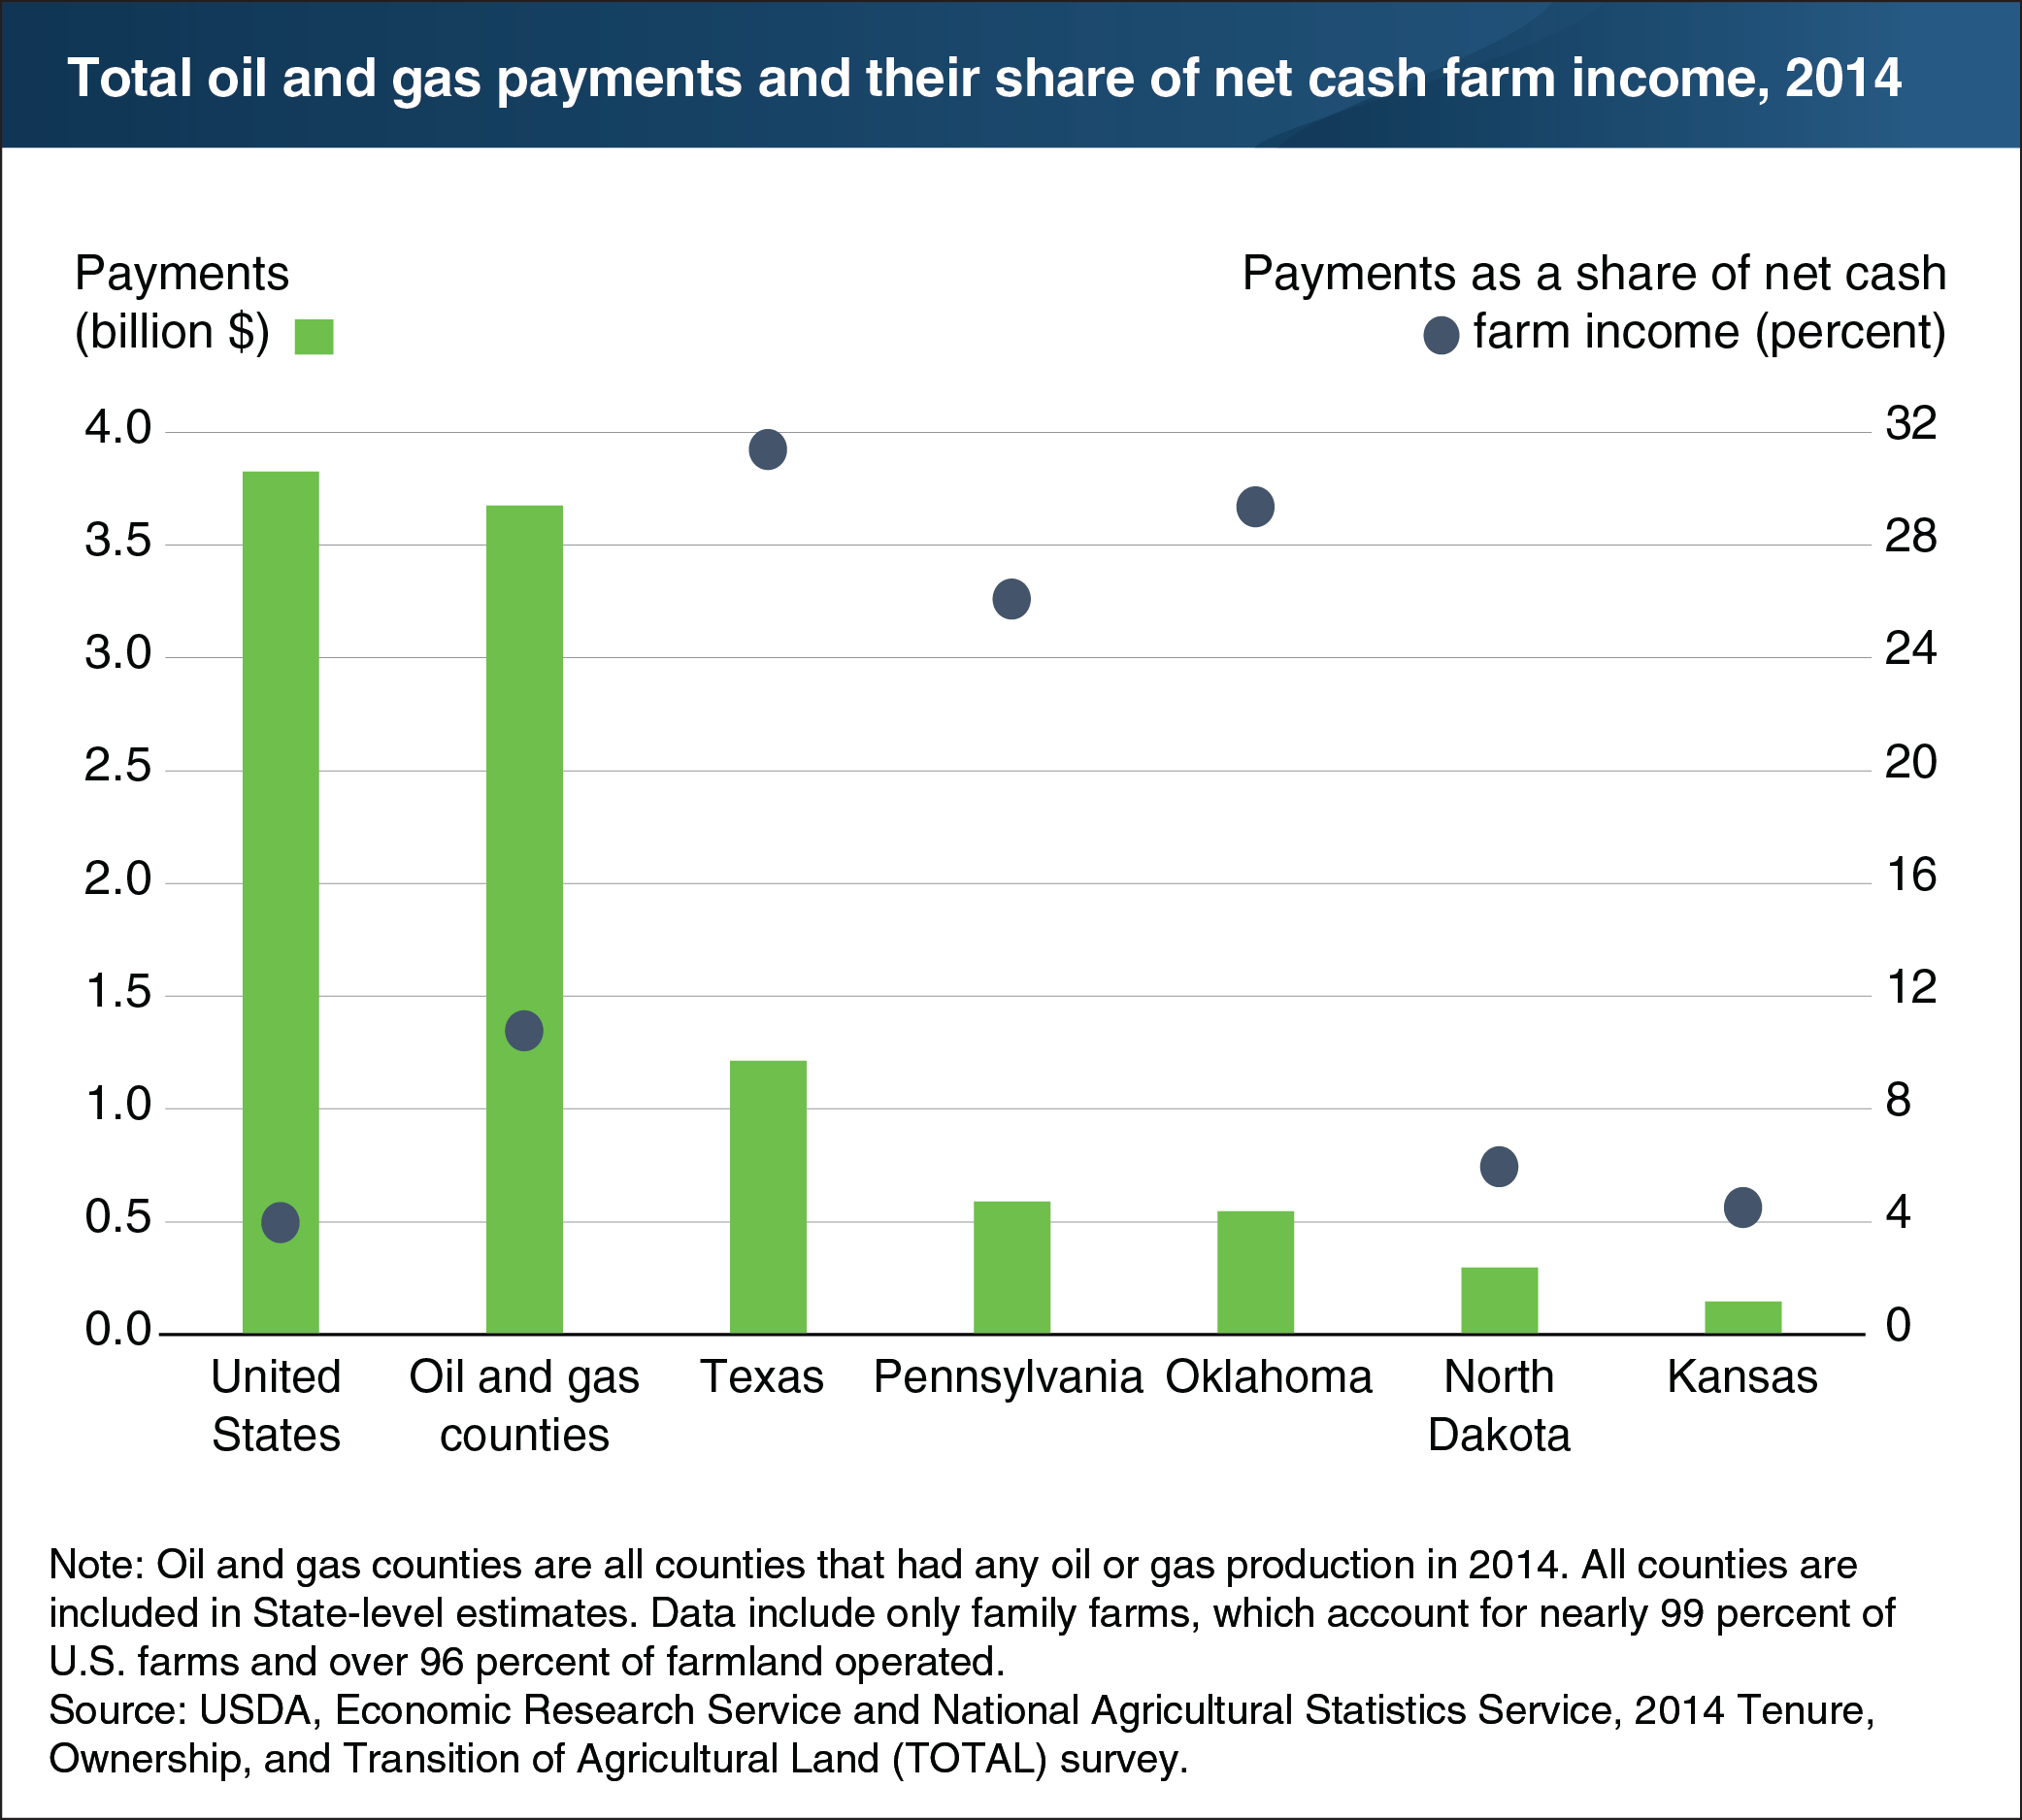
From 2005 to 2014, high energy prices and innovation in extraction methods enabled U.S. production of oil and gas to grow by 69 percent, with almost 67 percent of overall production occurring on farmland. The growth generated tens of billions of dollars of additional revenue for owners of oil and gas rights and increased the value of those rights. In 2014, farm operators owned $19.1 billion in oil and gas rights that generated $3.8 billion in payments through leases with energy firms. These payments accounted for about 4 percent of net cash farm income nationally in 2014, but made up a more substantial portion of farm income (11 percent) in oil and gas production regions. The share attributable to royalty income was particularly noteworthy in Texas, Oklahoma, and Pennsylvania, where oil and gas payments amounted to about 30 percent of net cash farm income. These States are host to productive shale plays, including the Marcellus, Barnett, Eagle Ford, and Woodford plays. This chart appears in the June 2018 ERS report, Ownership of Oil and Gas Rights: Implications for U.S. Farm Income and Wealth.