
The price of fertilizer and the prices received for crops have both trended downward in recent years
- by Roberto Mosheim
- 3/26/2018
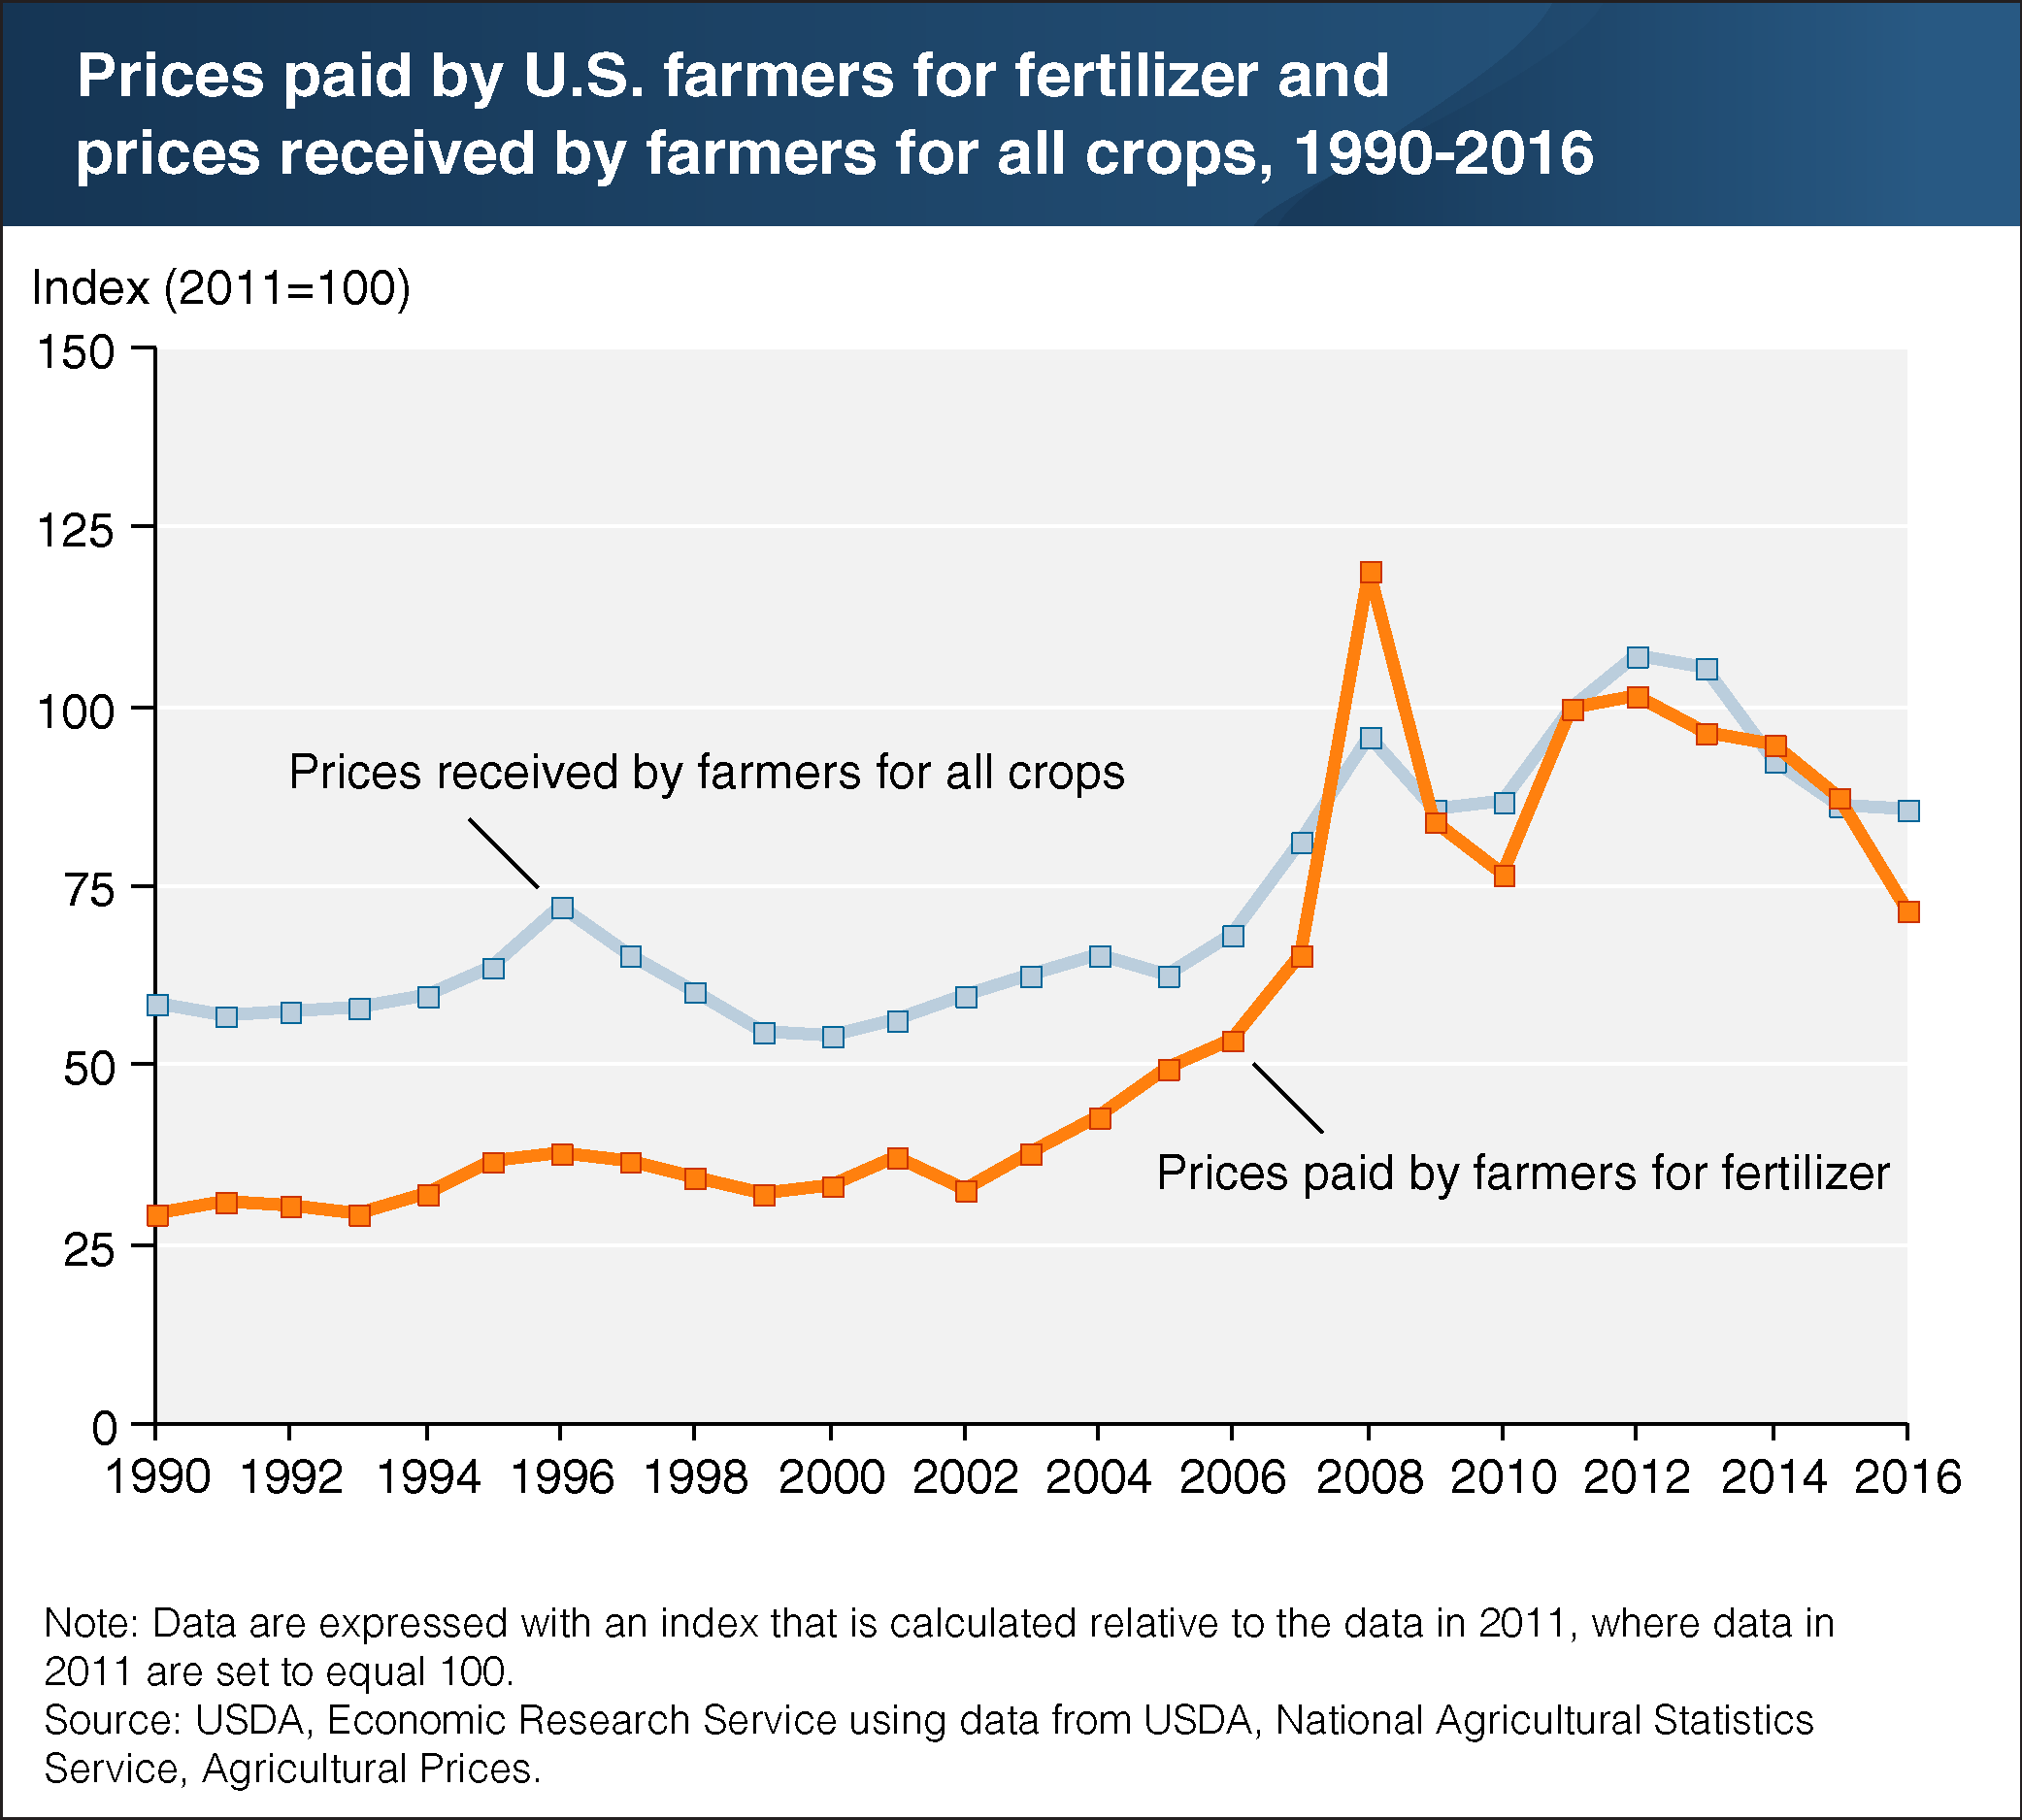
Fertilizers provide nutrients (such as nitrogen) essential in crop production. The amount of fertilizer farmers apply can be affected by changes in fertilizer prices paid, variation in production practice, crop mix, and the prices received from crop sales. Fertilizer prices paid and the prices received for crops increased in tandem at a fairly modest rate from 1960 through 2002. Between 2002 and 2008, annual fertilizer prices paid increased rapidly—generally much faster than increases in crop prices received by farmers—and became more volatile. Fertilizer price increases through 2008 were largely driven by high energy prices and the record costs of natural gas (a basic input to produce nitrogen). In response to record fertilizer prices in 2008, farmers reduced their use of fertilizers, contributing to a large decline (18 percent) in fertilizer prices through 2010. Fertilizer prices recovered somewhat—driven by strong domestic demand for plant nutrients due to high crop prices and limited domestic production capacity—but are currently trending downward, along with crop prices received. This chart appears in the ERS data product Fertilizer Use and Price, updated February 2018.