
Cropland has shifted to larger farms over the last three decades
- by James M. MacDonald
- 3/15/2018
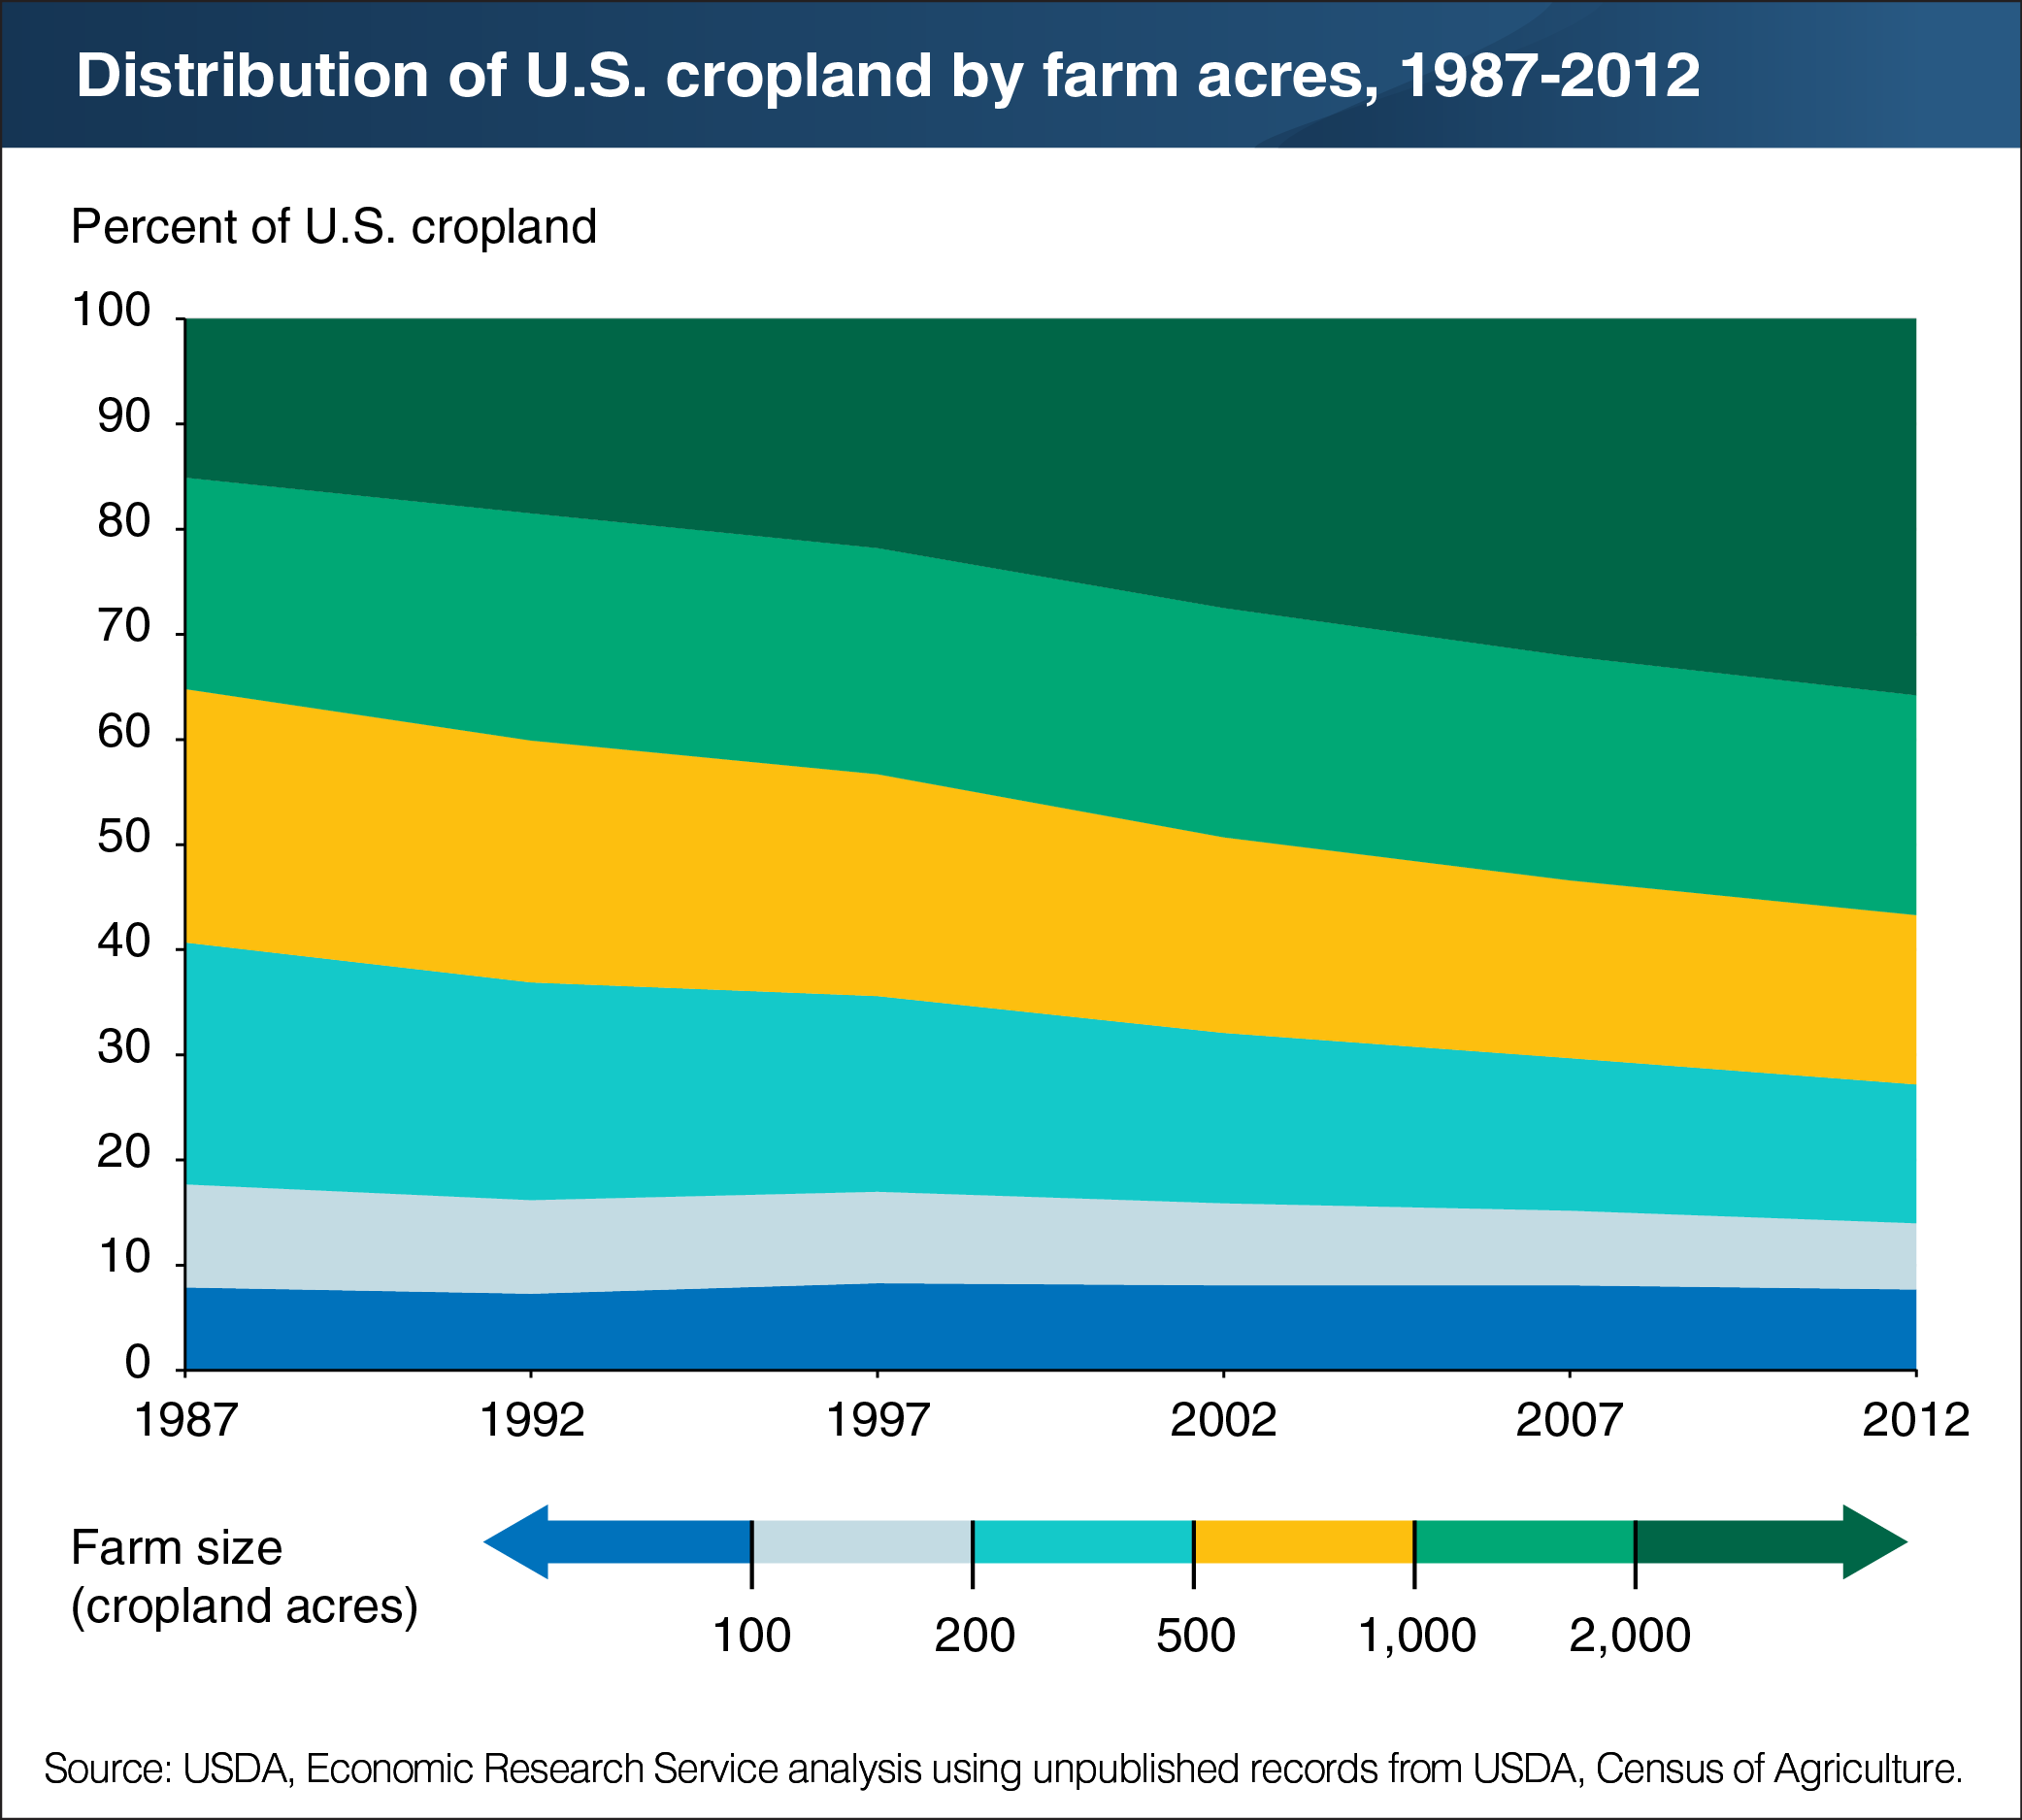
Agricultural production has shifted to much larger farming operations over the last three decades. In 1987, more than half (57 percent) of all U.S. cropland was operated by midsize farms that had between 100 and 999 acres of cropland. The largest farms with at least 2,000 acres operated only 15 percent of U.S. cropland that year. By 2012, midsize farms held 36 percent of cropland, the same share as that held by the largest farms. That shift occurred persistently over time, as the share held by the largest farms increased in each Census of Agriculture after 1987—in 1992, 1997, 2002, 2007, and 2012—while the share held by midsize farms fell in each census. By comparison, the share of cropland held by the smallest farms with less than 100 acres changed little over time, remaining at about 8 percent. Consolidation can occur through shifts in ownership, as operators of larger farms purchase land from retiring operators of midsize farms. However, most cropland is rented, and farms frequently expand by renting more cropland, often from retired farmers and their relatives. This chart appears in the ERS report, Three Decades of Consolidation in U.S. Agriculture, released March 2018.