
Low-income countries had the highest rate of agricultural growth, but middle-income countries had the highest rate of productivity growth
- by Keith Fuglie and Nicholas Rada
- 10/16/2017
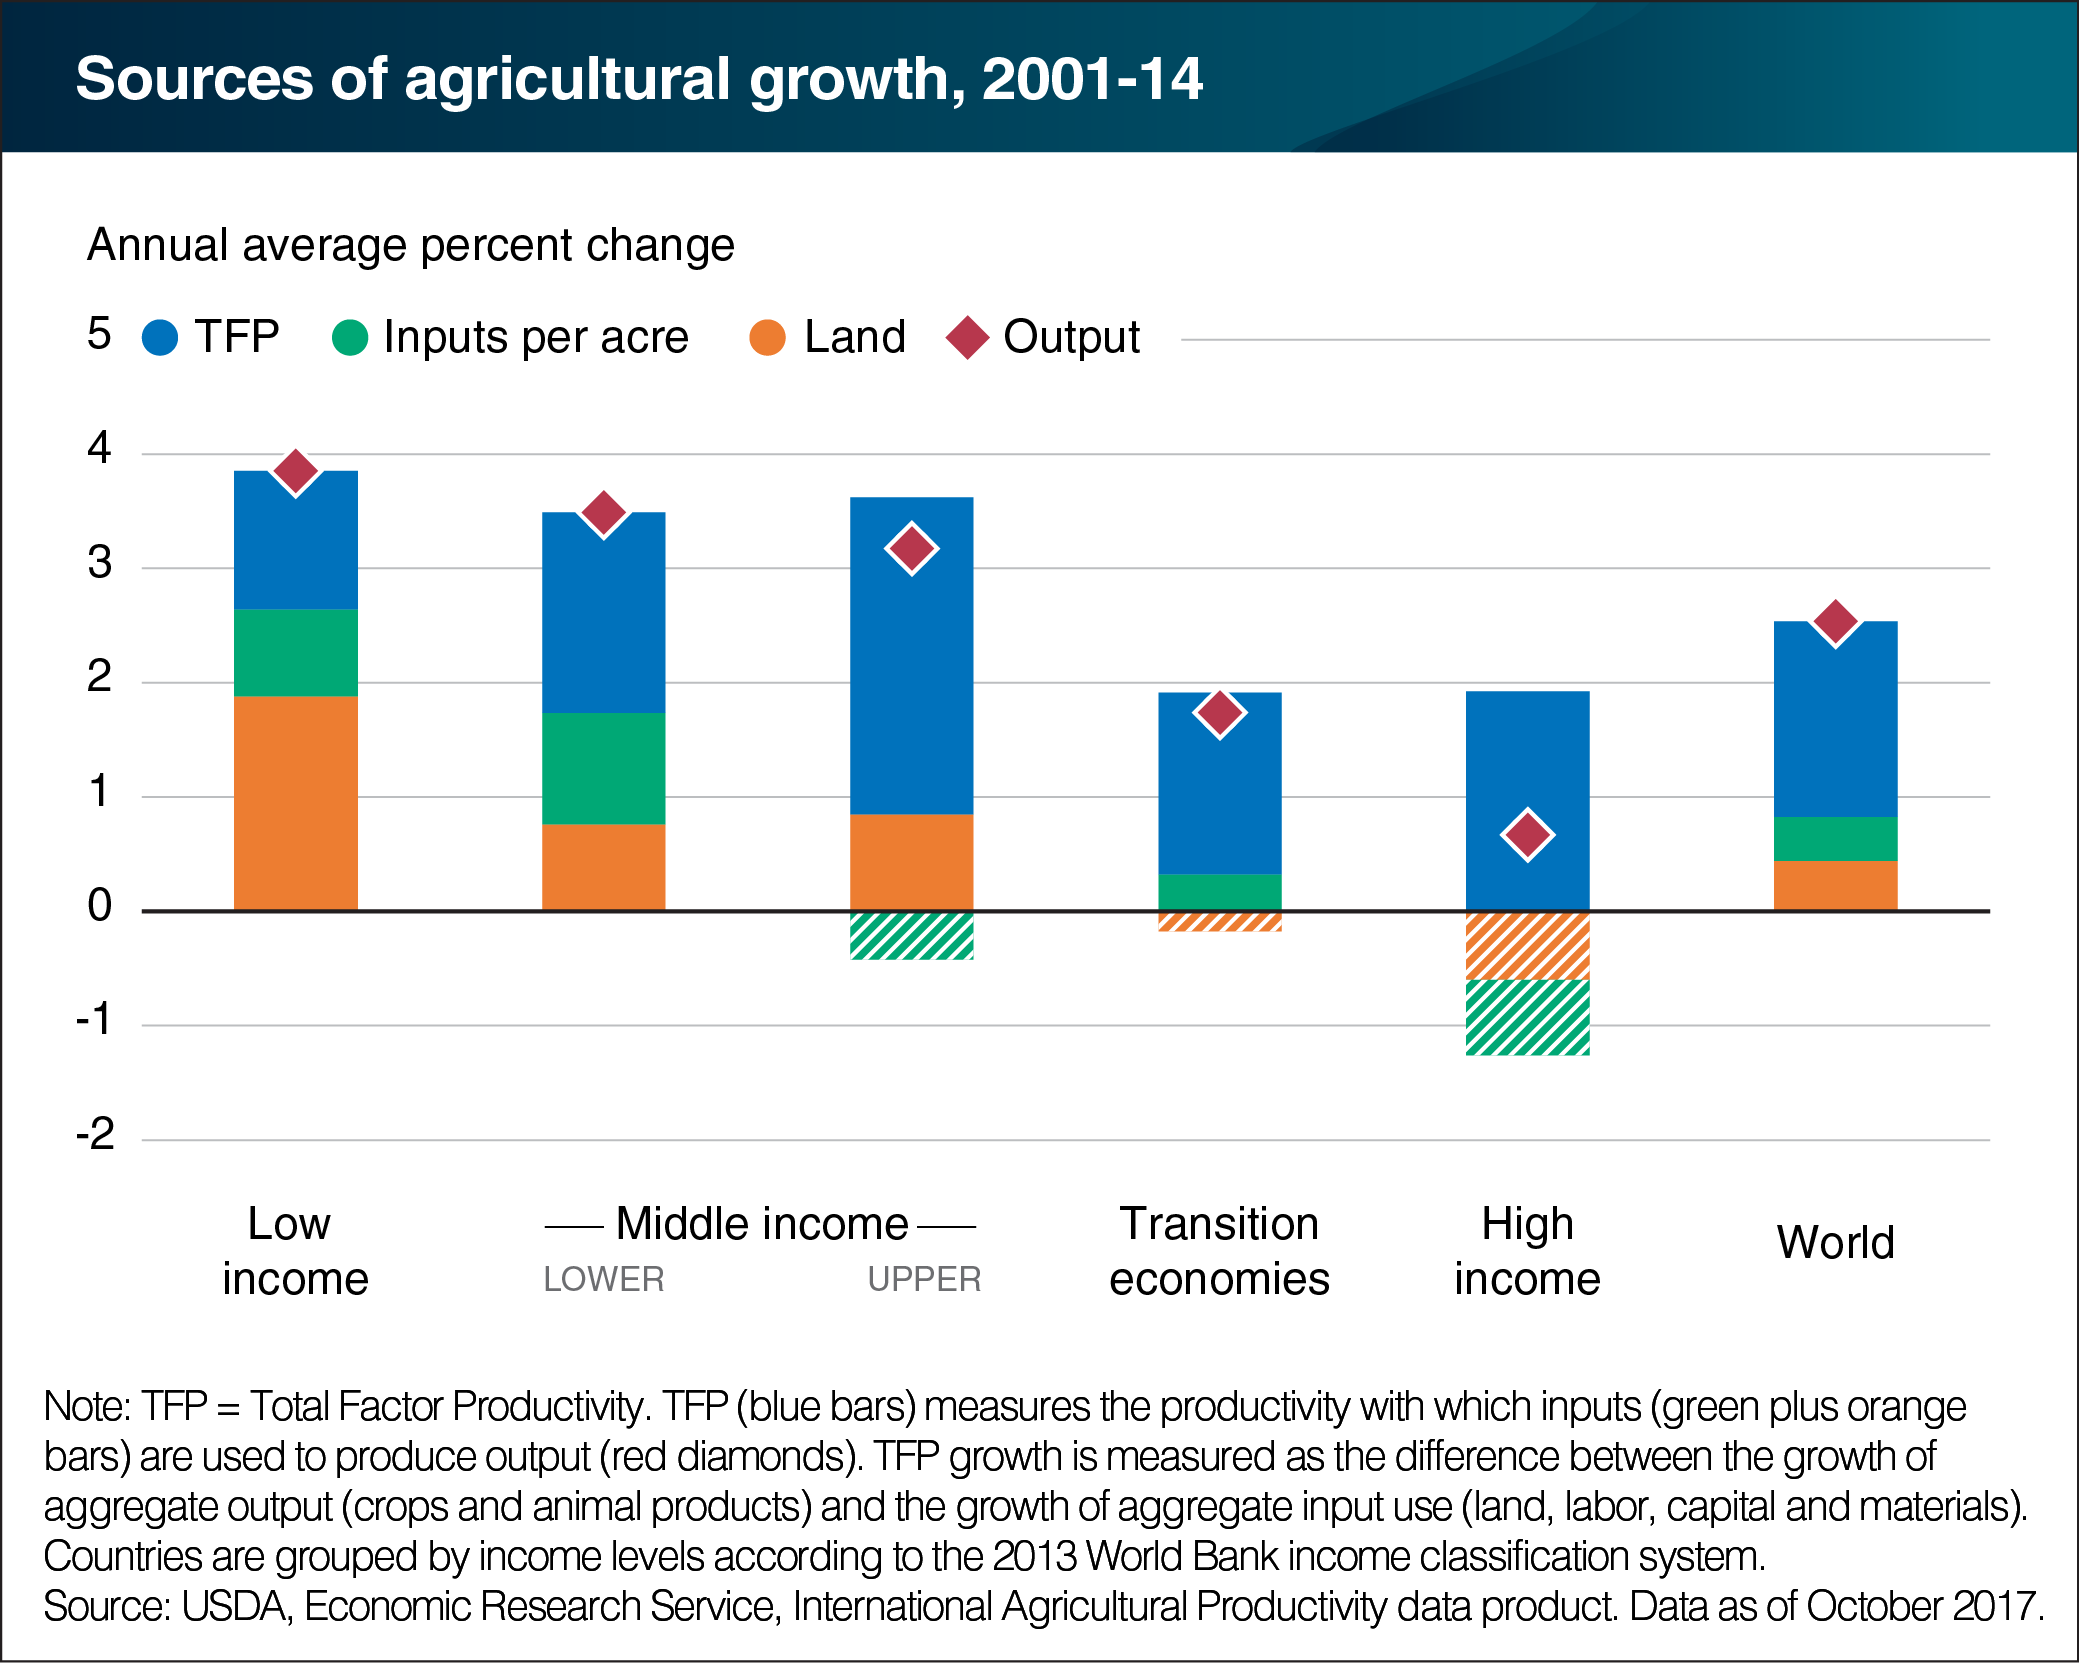
During 2001-14, low-income countries accounted for only 5 percent of global agricultural production. But these countries achieved a higher rate of agricultural output growth than middle- or high-income countries, at nearly 4 percent per year during that period. Most of that development came from increasing the use of land and other inputs, rather than from raising the total productivity of those inputs. Middle-income countries, on the other hand, accounted for 40 percent of global agricultural production and achieved growth that was nearly as high (more than 3.5 percent per year), largely because of improving productivity. For high-income countries, which accounted for 25 percent of global production, agricultural growth averaged under 2 percent per year, even as land and other inputs employed in the sector fell. Improvements in productivity account for all the output growth in high-income countries. Overall, most gains in global agricultural productivity have come from middle-income countries. Strengthening the capacity of national agricultural research and extension systems in large middle-income countries (such as Brazil and India) has been a key determinant of their agricultural productivity performance. This chart appears in the ERS topic page for International Agricultural Productivity, updated October 2017.