
Berries led growth in frozen fruit consumption over the last three decades
- by Linda Kantor
- 8/9/2017
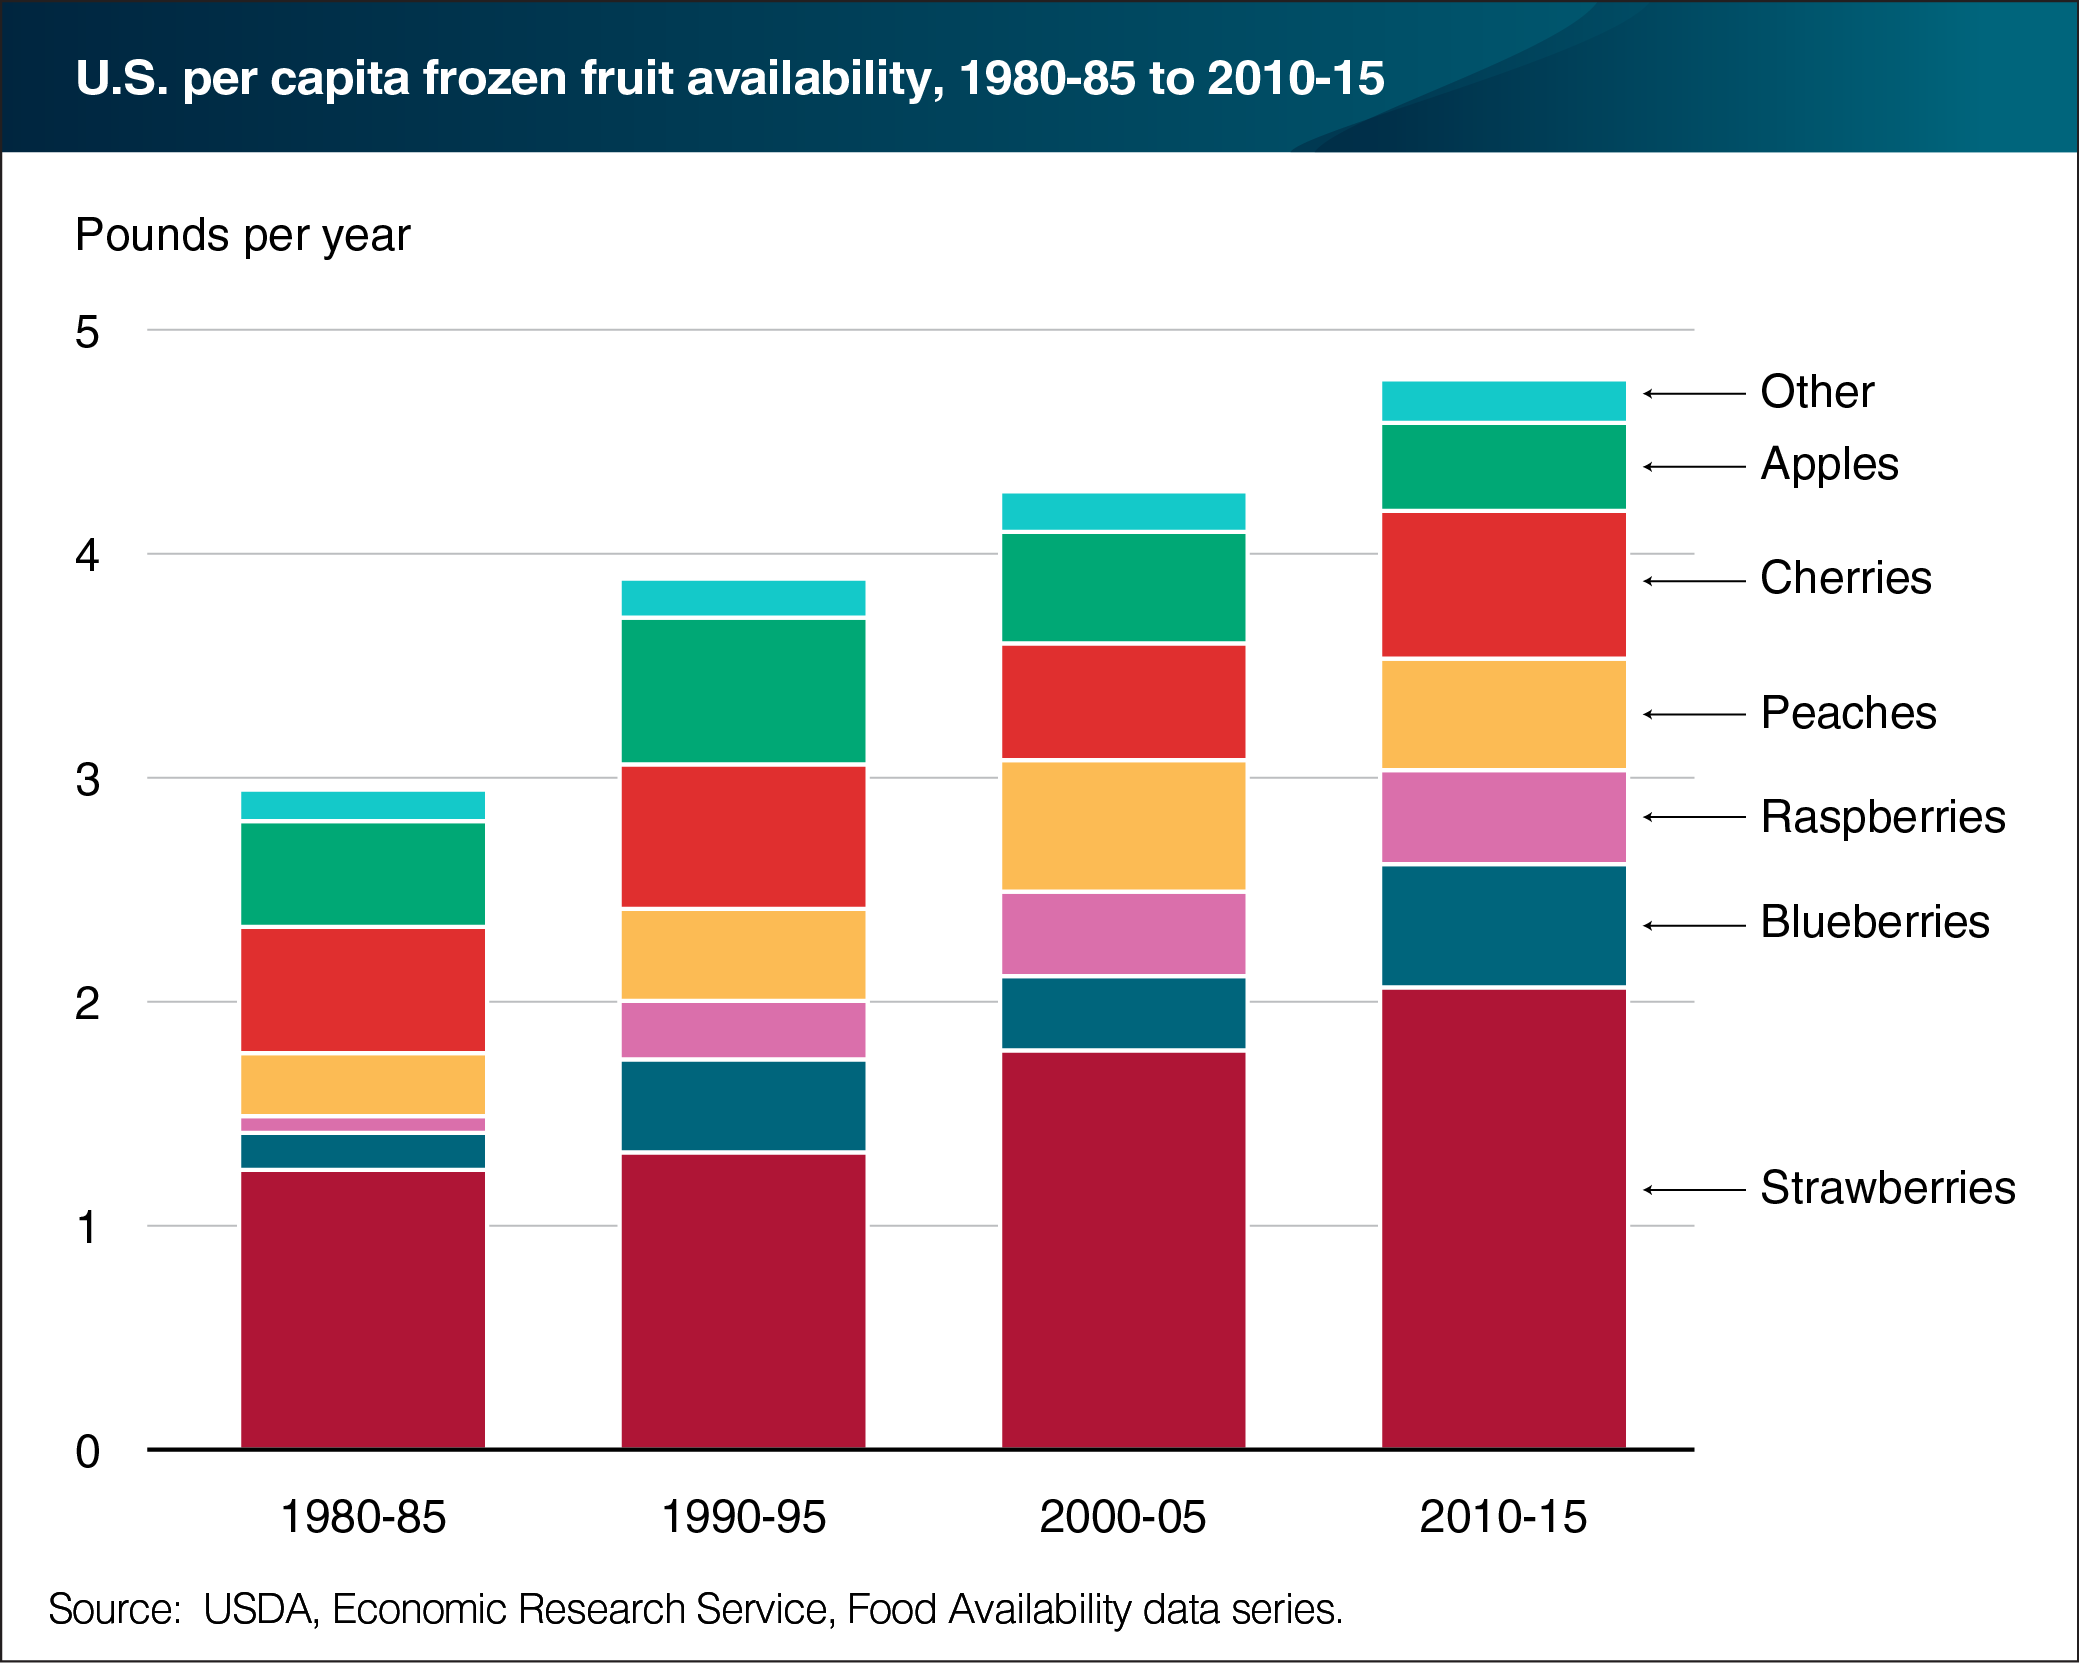
America’s love affair with frozen smoothies continues to grow and along with it consumption of its quintessential ingredient, frozen fruit. Between the early 1980s and 2015, the annual supply of frozen fruit available for consumption, led by a doubling in demand for frozen berries, grew by 61 percent to 4.8 pounds per person—about 5 percent of 2015’s total U.S. fruit availability. While strawberries remain consumers’ favorite frozen fruit—accounting for 40 percent of availability in 2015—blueberries and raspberries increased their share from 8 percent in 1980-85 to 20 percent in 2010-15. Peaches led the growth in availability of non-berry frozen fruits, followed by cherries. Frozen apples, used mainly in commercial and foodservice baking, lost market share, dropping from 17 to 8 percent of frozen fruit availability over 1980-2015. Consumer demand for healthy, convenient foods and manufacturers’ use of improved freezing technologies to improve product quality, along with colorful packaging and smoothie-ready fruit combinations and add-ins, underlie the growth in frozen fruit consumption. The data for this chart are from ERS’s Food Availability (Per Capita) Data System, updated July 26, 2017.