
With fewer breeding sows than in the past, efficiency gains have resulted in more pigs per sow per year
- by Mildred Haley
- 2/28/2017
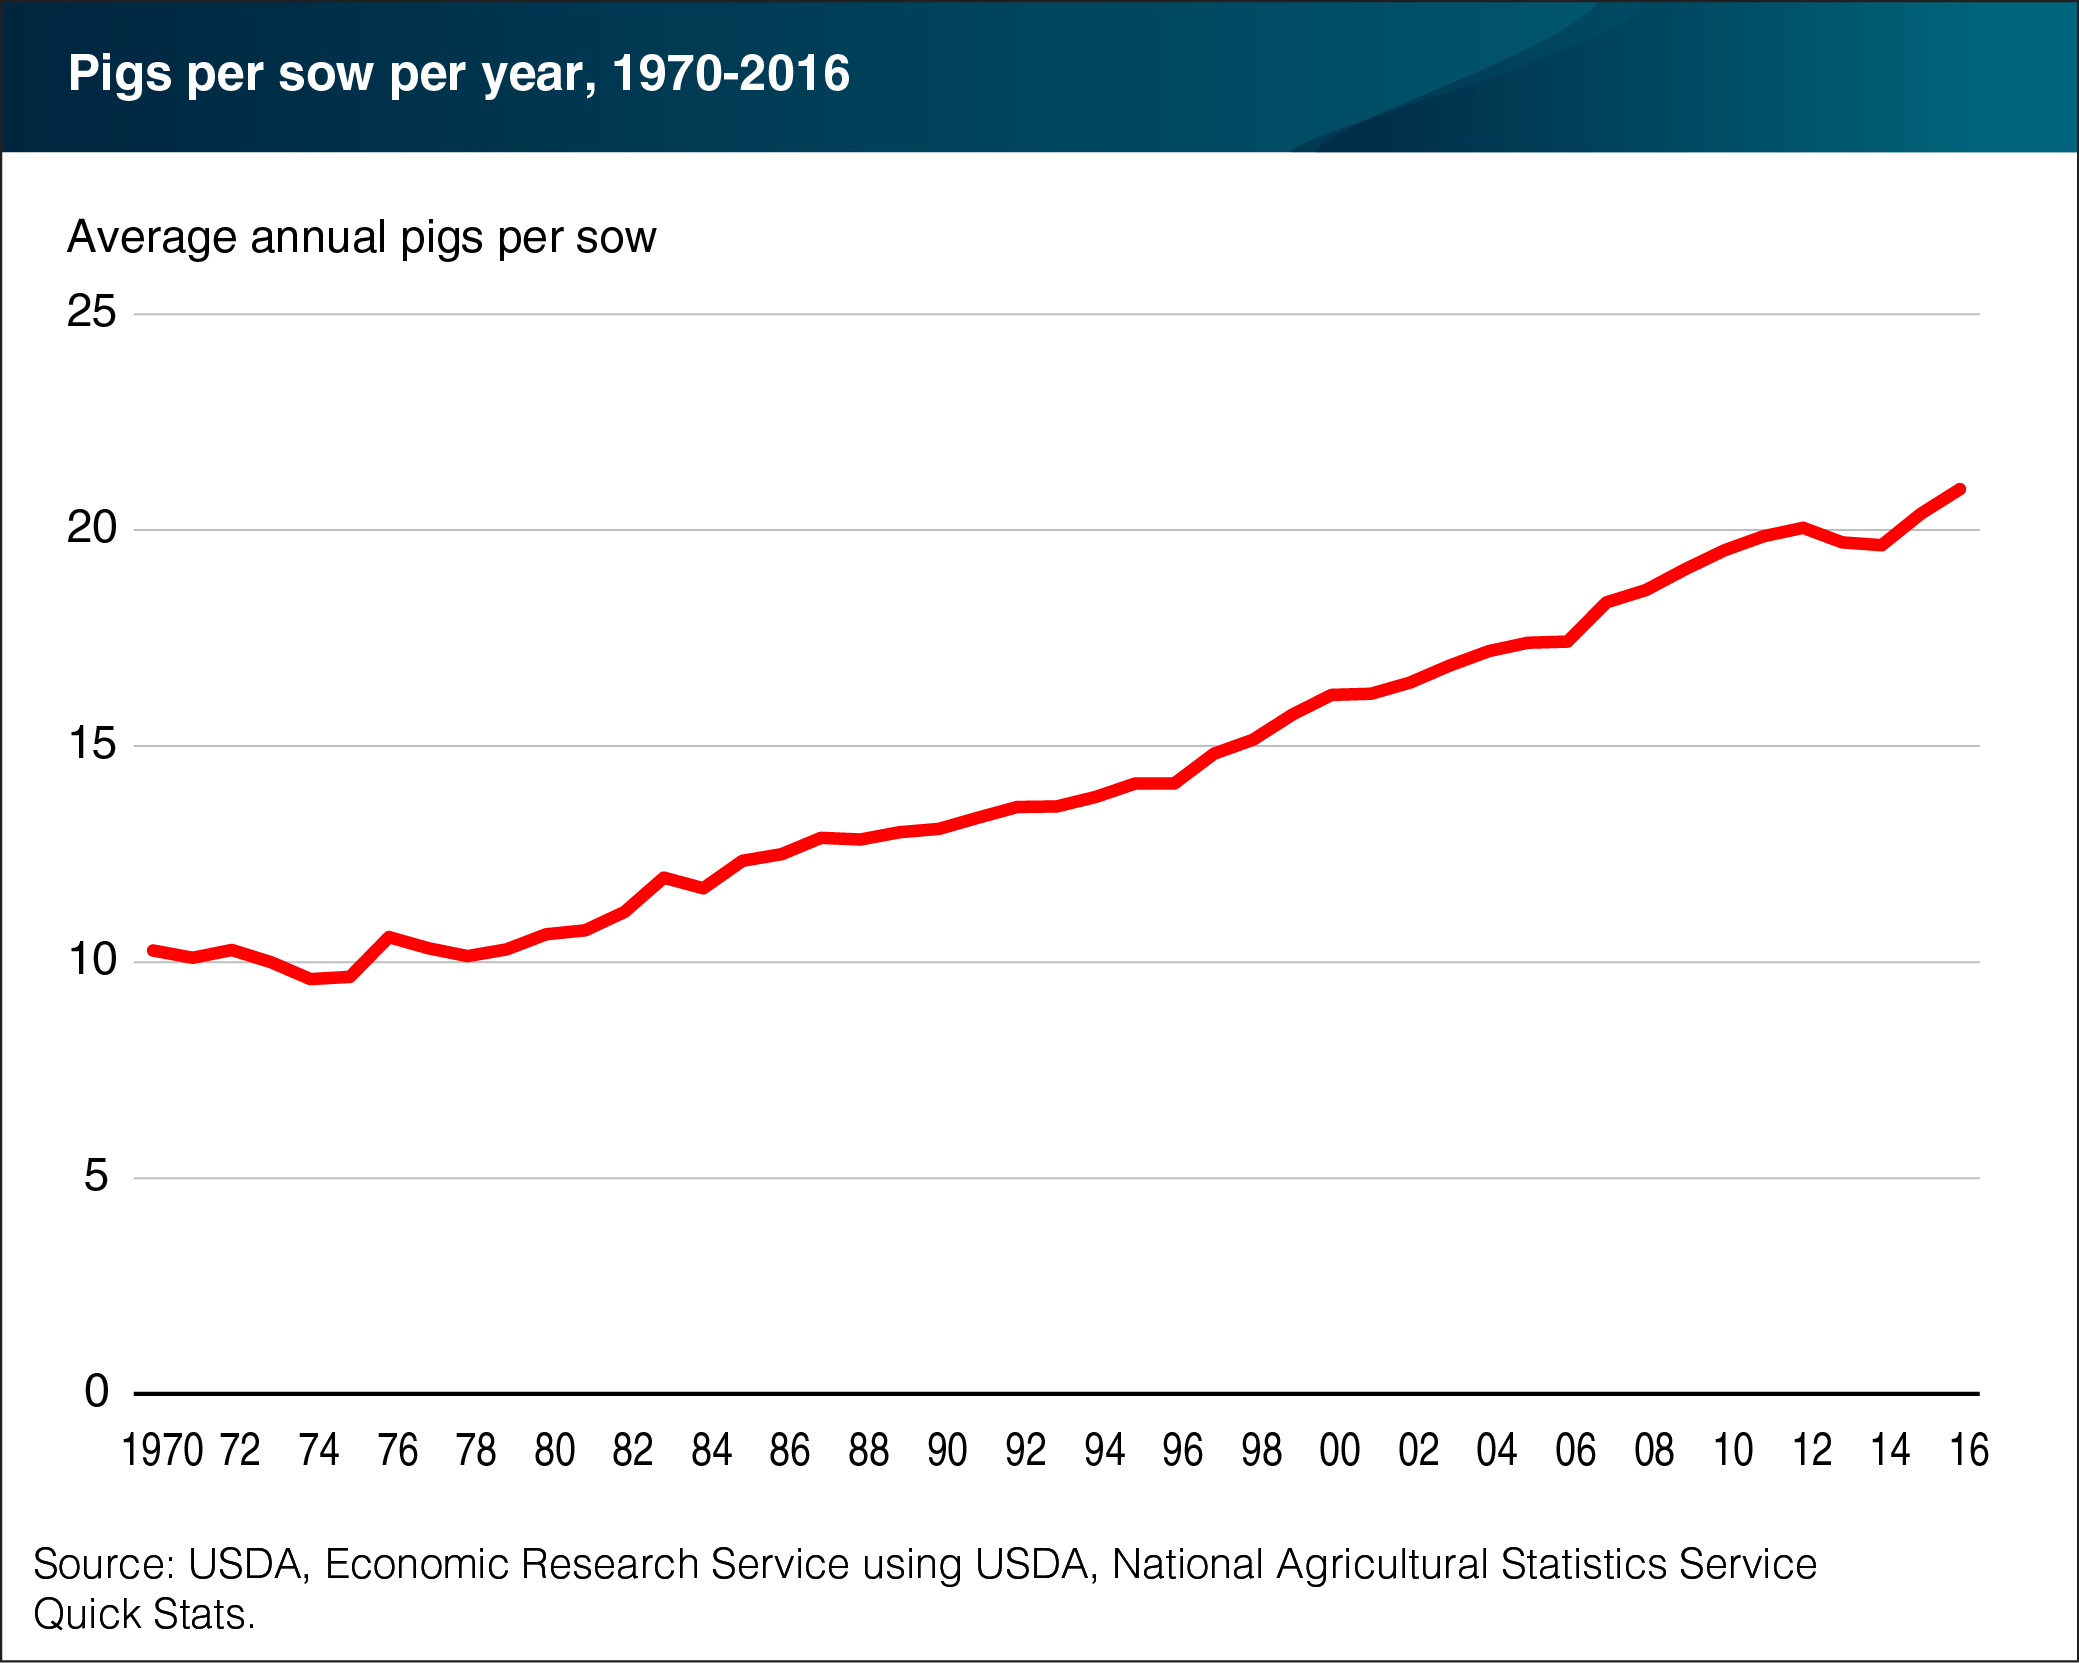
To measure productivity gains, the hog industry commonly uses the average number of pigs produced by breeding sows per year. To meet demand, farmers needed a far larger number of breeding sows in 1970 than present day due to lower litter rates. The breeding inventory for that year was 65 percent higher than the current inventory, but the litter rate per sow was only 7.4 pigs. On average, this resulted in just over 10 pigs produced per sow. In 2016, an increased litter rate of 10.6 and more frequent farrowings led to an average of 20.95 pigs per sow. These efficiency gains are because of genetic improvements of breeding stock, advancements in survival rates, and more effective cycling of sows between breeding and recovery periods. This chart appears in the ERS Livestock Dairy and Poultry Outlook report released in January 2017.