
Fresh and frozen shellfish lead the growth in seafood availability
- by Linda Kantor
- 10/18/2016
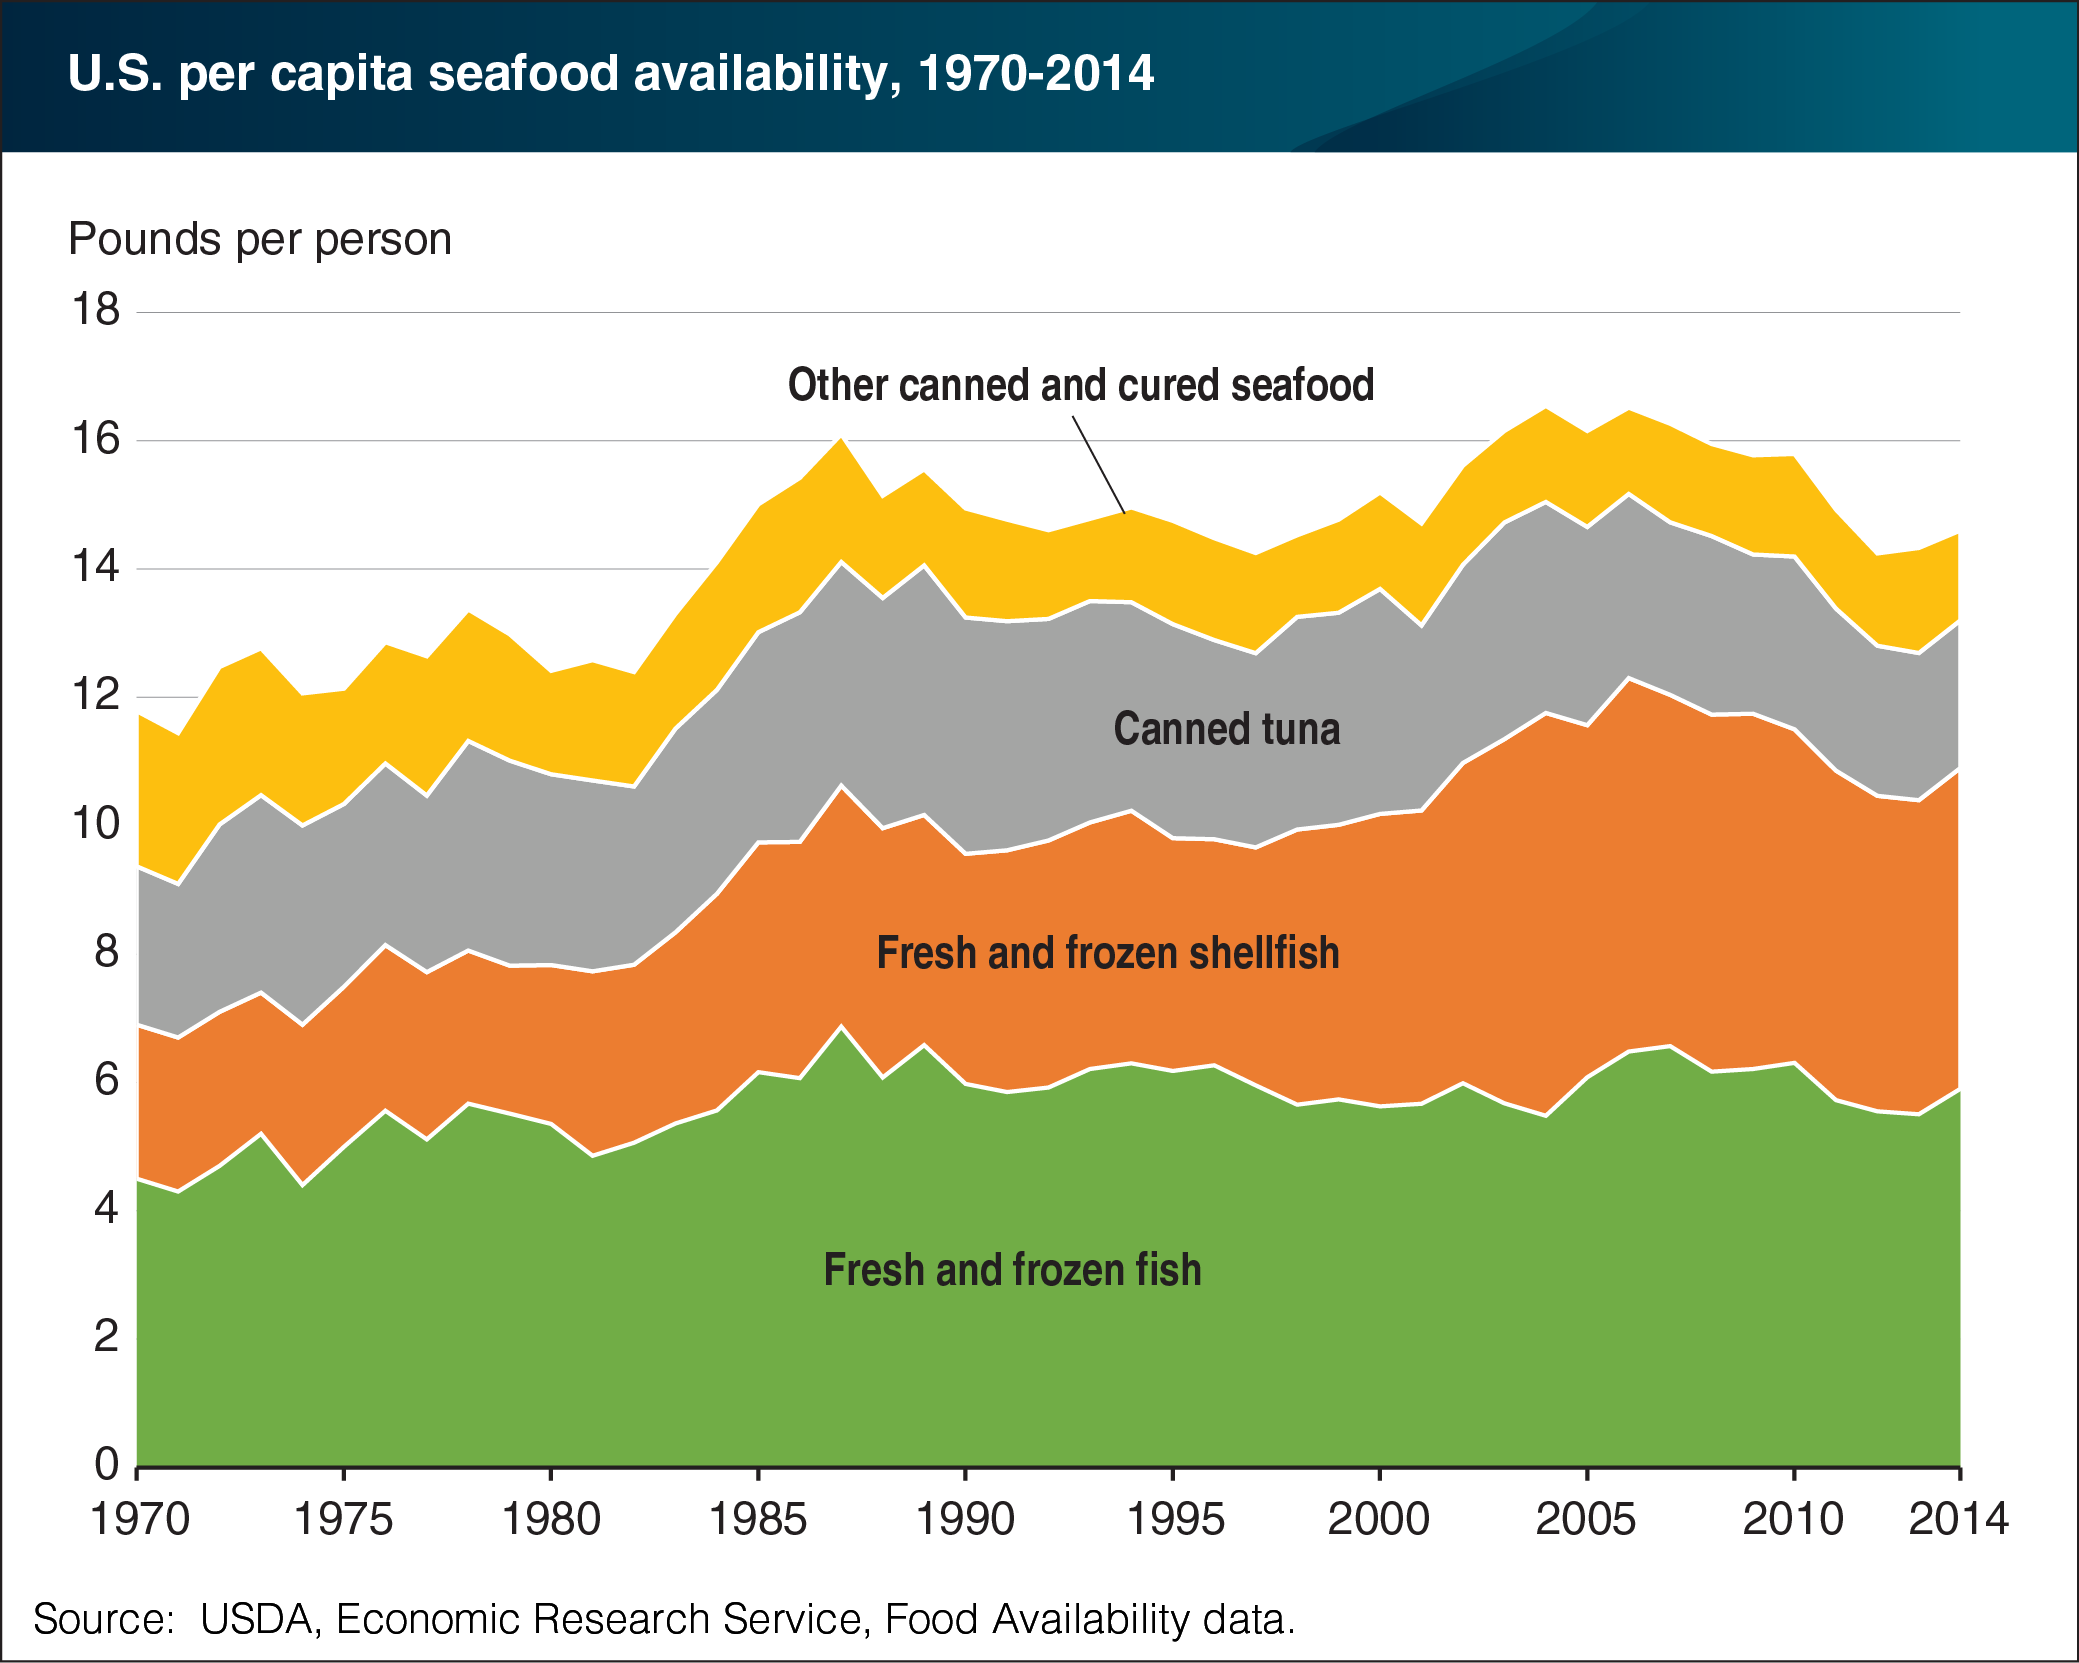
The supply of seafood available for consumption in the United States is up from 11.7 pounds per person in 1970—but down from a peak of 16.5 pounds in 2006—according to ERS food availability data. In 1970, fresh and frozen shellfish accounted for 21 percent of seafood availability. In 2014, by comparison, fresh and frozen shellfish (mostly shrimp) accounted for 34 percent of the 14.5 pounds per capita of seafood available for consumption. New efficiencies in shrimp aquaculture beginning in the early 1980s, which sharply increased availability and reduced prices, made shrimp a popular menu item at fast casual dining places across the United States. A 35-percent decline in canned tuna availability since 2000 was largely offset by a surge in fresh and frozen fish availability from low-cost imports of farm-raised salmon and tilapia and the increased use of wild-caught Alaska pollock in frozen fish sticks, imitation crab meat, and fast-food sandwiches. This chart appears in “Americans’ Seafood Consumption Below Recommendations” in the October 2016 issue of ERS’s Amber Waves magazine.