
Prevalence of food insecurity in 2015 was lower than 2014, still above level before Great Recession
- by Christian A. Gregory
- 9/8/2016
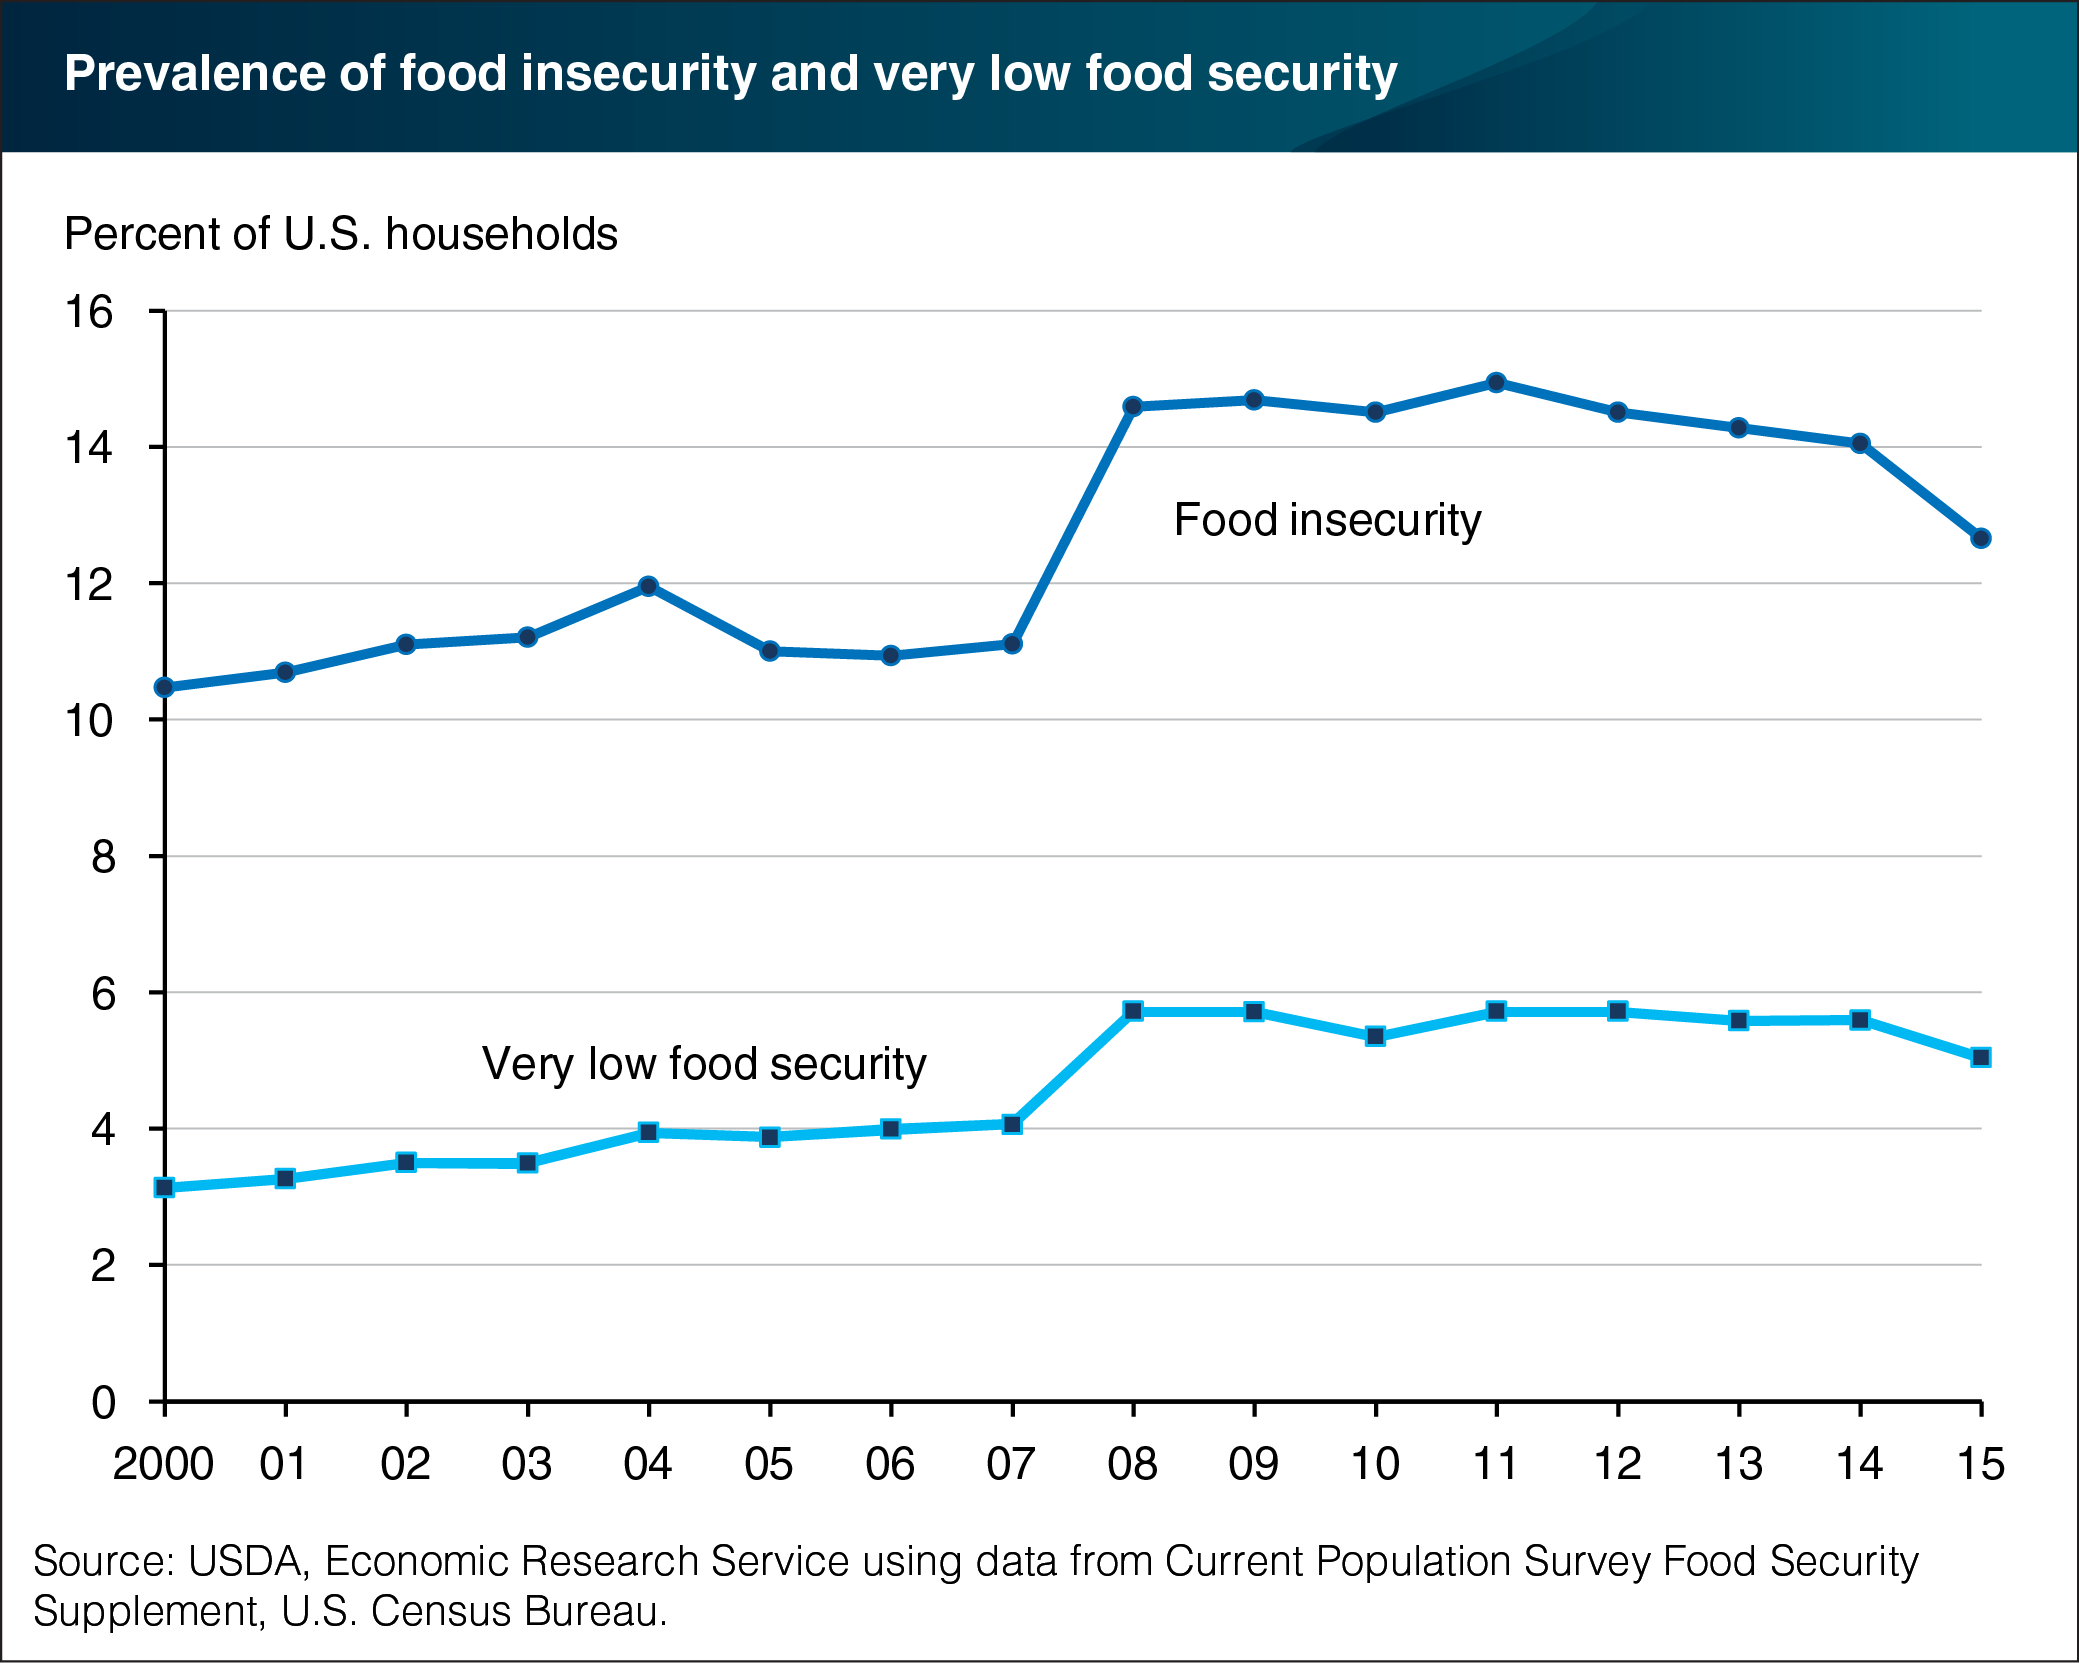
In 2015, 87.3 percent of U.S. households were food secure throughout the year. The remaining 12.7 percent (15.8 million households) were food insecure; they had difficulty at some time during the year providing enough food for all their members due to a lack of resources. The percentage of U.S. households that were food insecure declined from 14.0 percent in 2014. Additionally, in 2015, 5.0 percent of U.S. households (6.3 million households) had very low food security. In this more severe range of food insecurity, the food intake of some household members was reduced and normal eating patterns were disrupted at times during the year due to limited resources. The rate, or prevalence, of very low food security in 2015 declined significantly from that in 2014 (5.6 percent). The 2015 declines in food insecurity and very low food security prevalence were the largest year-to-year changes in these rates since the two rates rose in 2008. This chart appears in the ERS report, Household Food Security in the United States in 2015 , released September 7, 2016.