
Prices of basic food ingredients outpaced prices of more convenient foods but with little impact on basic ingredient spending
- by Abigail Okrent
- 8/2/2016
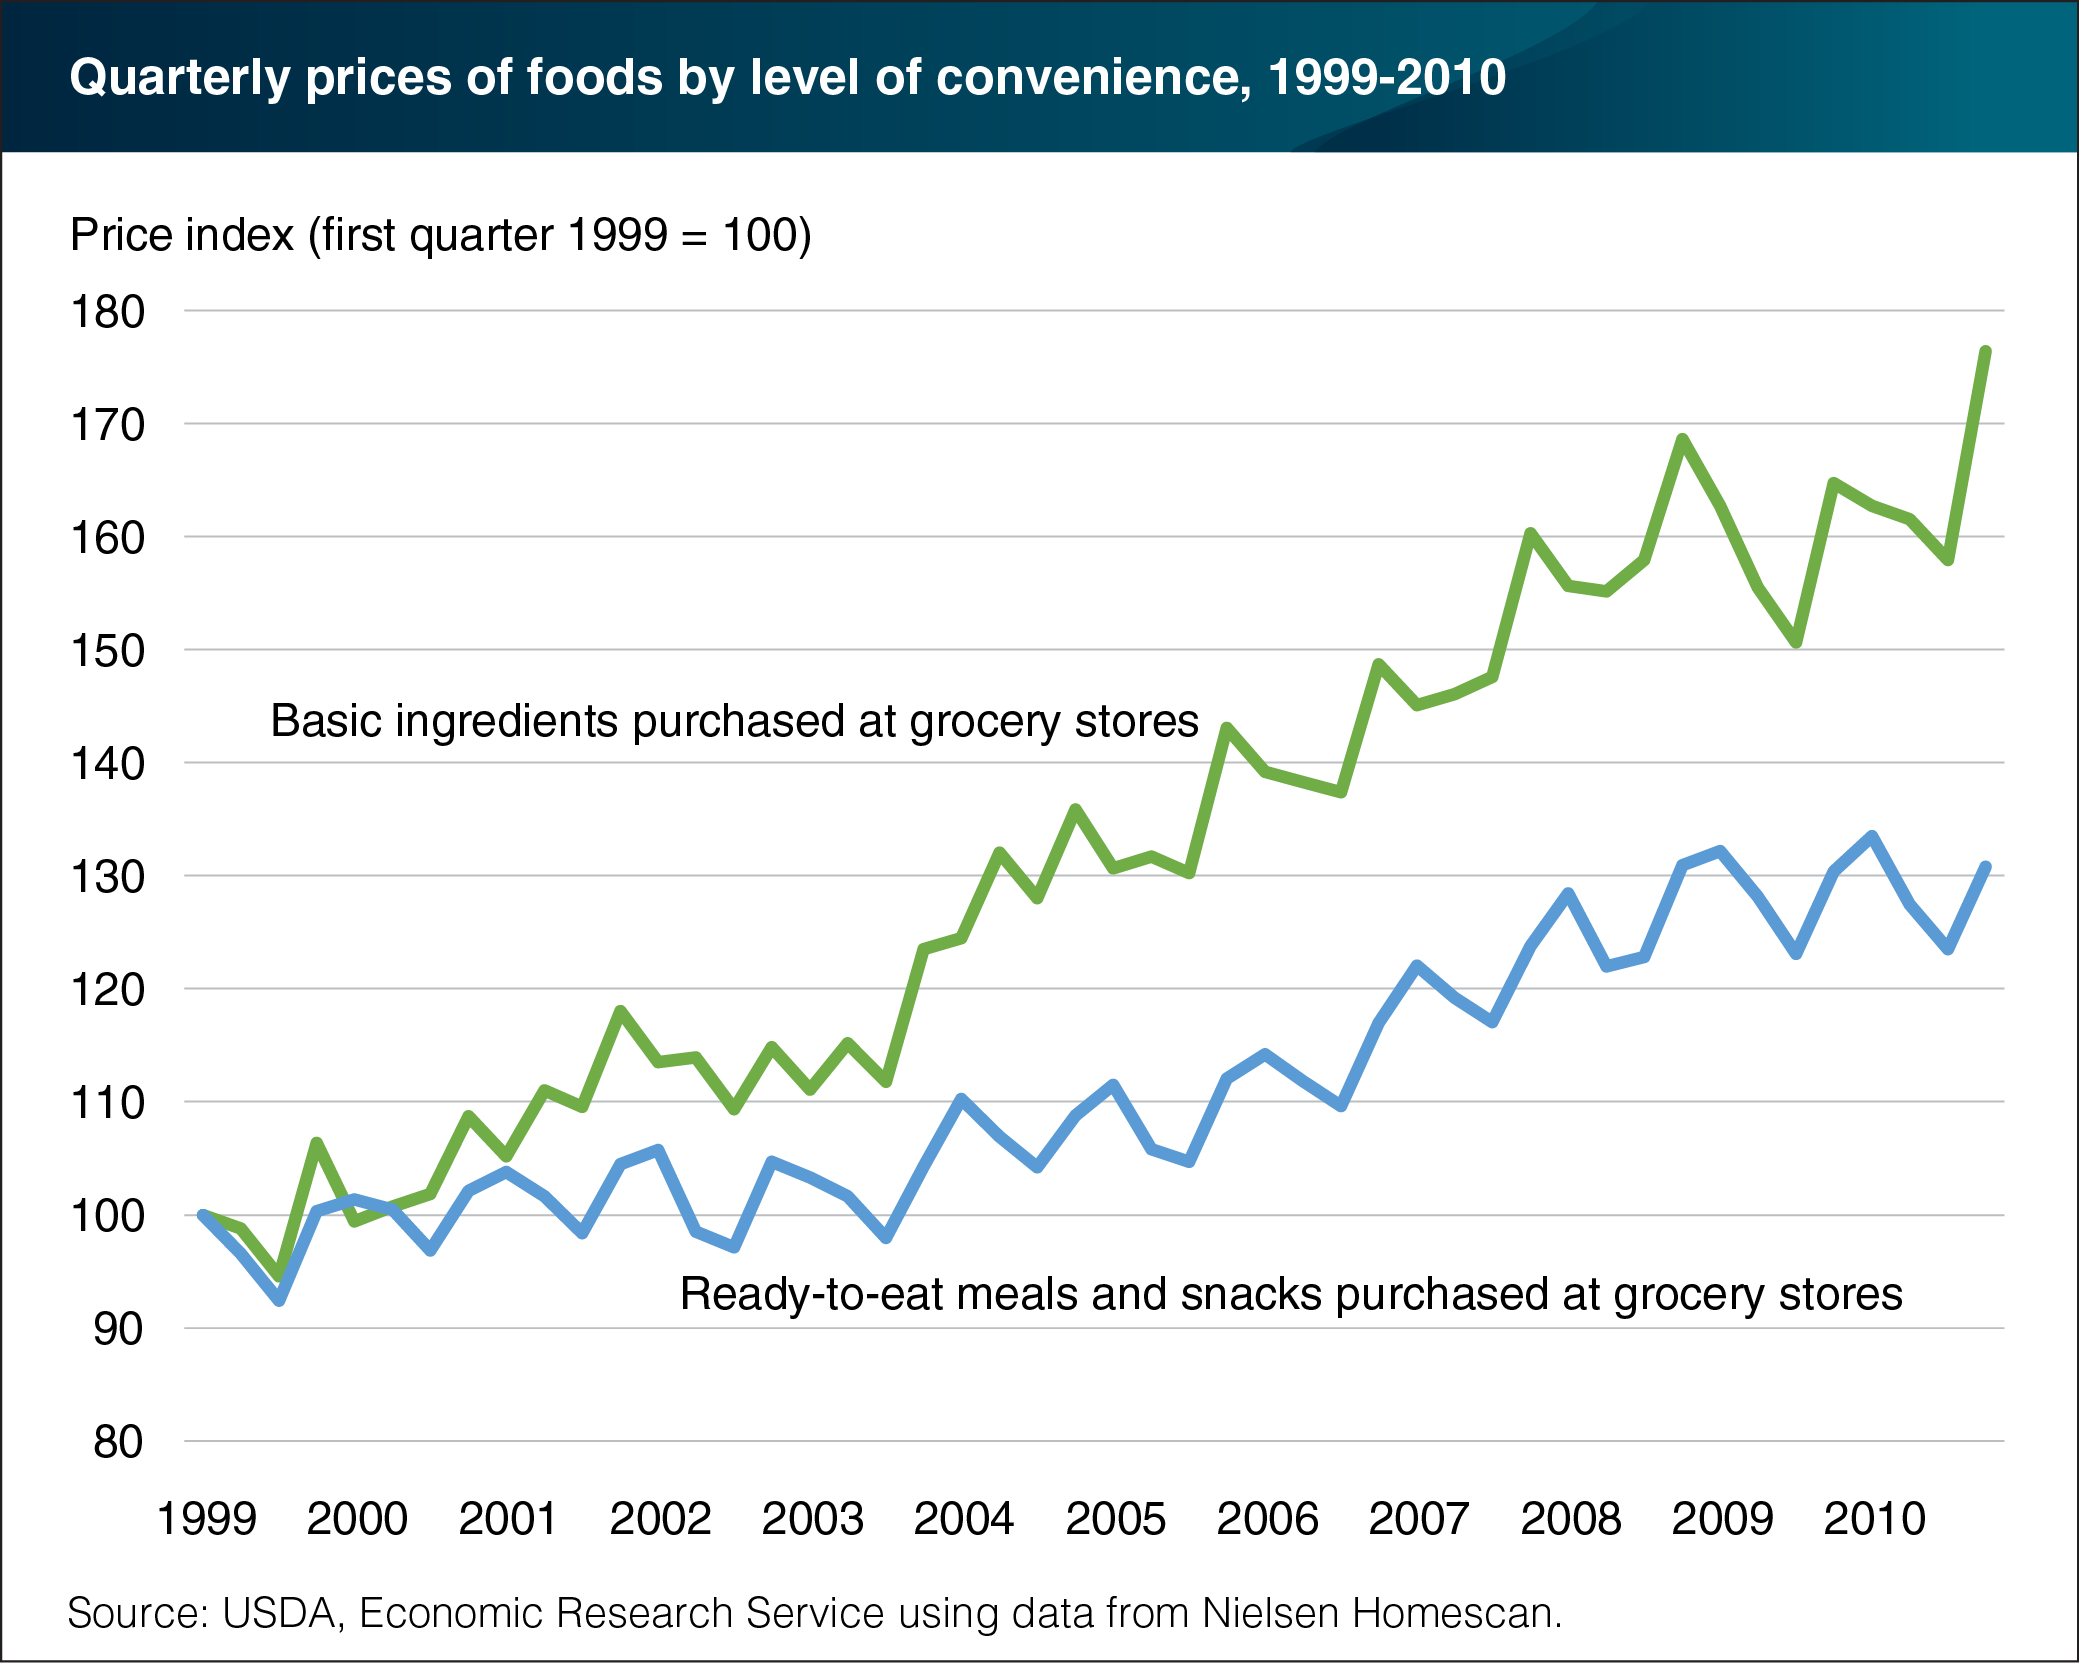
Beginning in 2004, prices of basic food ingredients purchased in grocery stores grew faster than prices of ready-to-eat meals and snacks purchased in grocery stores. Basic ingredients are raw or minimally processed foods, such as milk, dried beans, and fresh meat, used in producing a meal or snack. Ready-to-eat meals and snacks, such as refrigerated entrees and side dishes, yogurt, and candy, require no preparation beyond opening a container. A recent ERS analysis found that between 1999 and 2010, spending by a typical American household on basic ingredients was not as responsive to these price changes as spending on ready-to-eat meals and snacks. In the first quarter of 1999, 5.2 percent of the average food budget was spent on basic ingredients and 18.0 percent on ready-to-eat meals and snacks. By the fourth quarter of 2007, the share of total food expenditures spent on basic ingredients remained fairly constant but increased during the 2007-09 recession. The share of total food expenditures spent on ready-to-eat meals and snacks, on the other hand, steadily declined to 17.1 percent before rising back to 1999 levels during and following the 2007-09 recession. This chart appears in the ERS report, U.S. Households’ Demand for Convenience Foods, July 29, 2016.