
Farm sector real estate debt trends vary by lender
- by Economic Research Service
- 7/29/2016
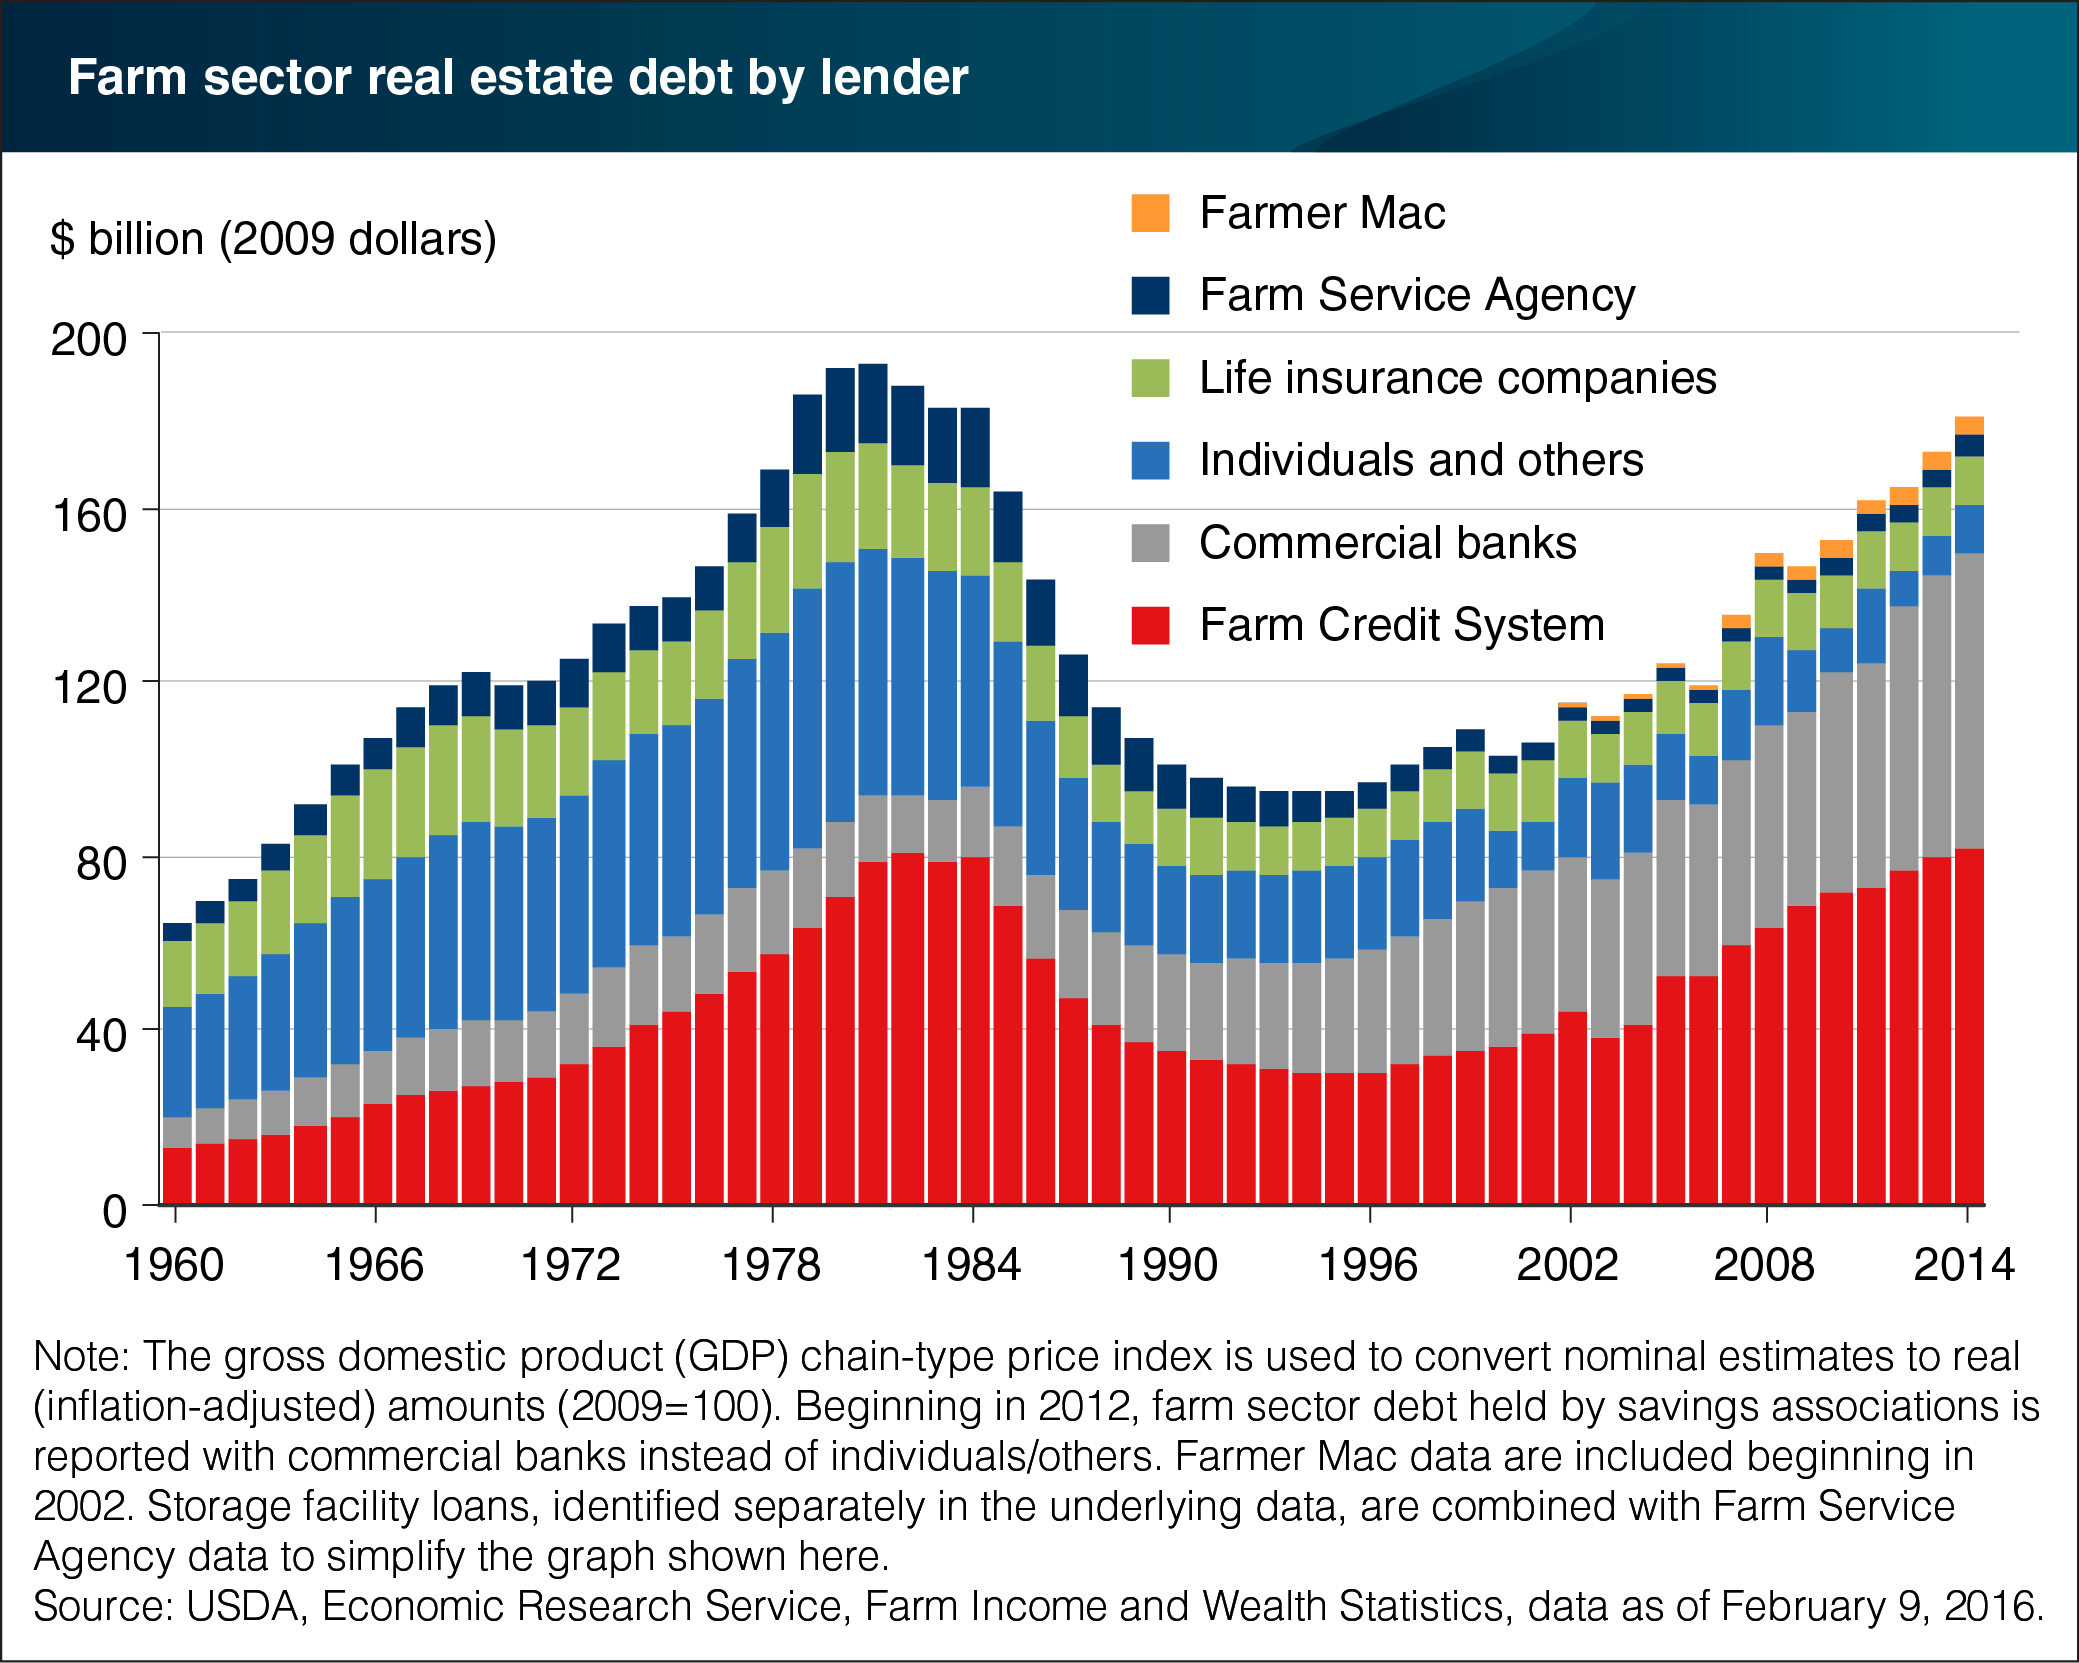
Since the late 1970s, the Farm Credit System (FCS) has been the largest U.S. lender to the farm sector for loans secured by real estate. The trend in outstanding real estate debt held by FCS closely tracks the overall sector real estate debt trend. Debt held by FCS peaked in the early 1980s and then declined for the next decade before increasing to an inflation-adjusted high of $81.7 billion in 2014. Prior to the 1990s, commercial banks held substantially less debt than the FCS. However, farm sector real estate debt held by commercial banks has increased sharply since the 1990s, leading commercial banks to become the second most prominent farm real estate lender. Farmer Mac, though small relative to FCS and commercial banks, has also shown growth in real estate debt outstanding during the period. While the real estate debt outstanding at FCS, commercial banks, and Farmer Mac has grown sharply since the 1990s, the trend has held relatively flat or declined modestly for the other lenders in that period. This chart is found in the July 2016 Amber Waves article, “Trends in Farm Sector Debt Vary by Type of Debt and Lender.”