
Distribution of farm program payments varies by farm type
- by Robert A. Hoppe
- 7/12/2016
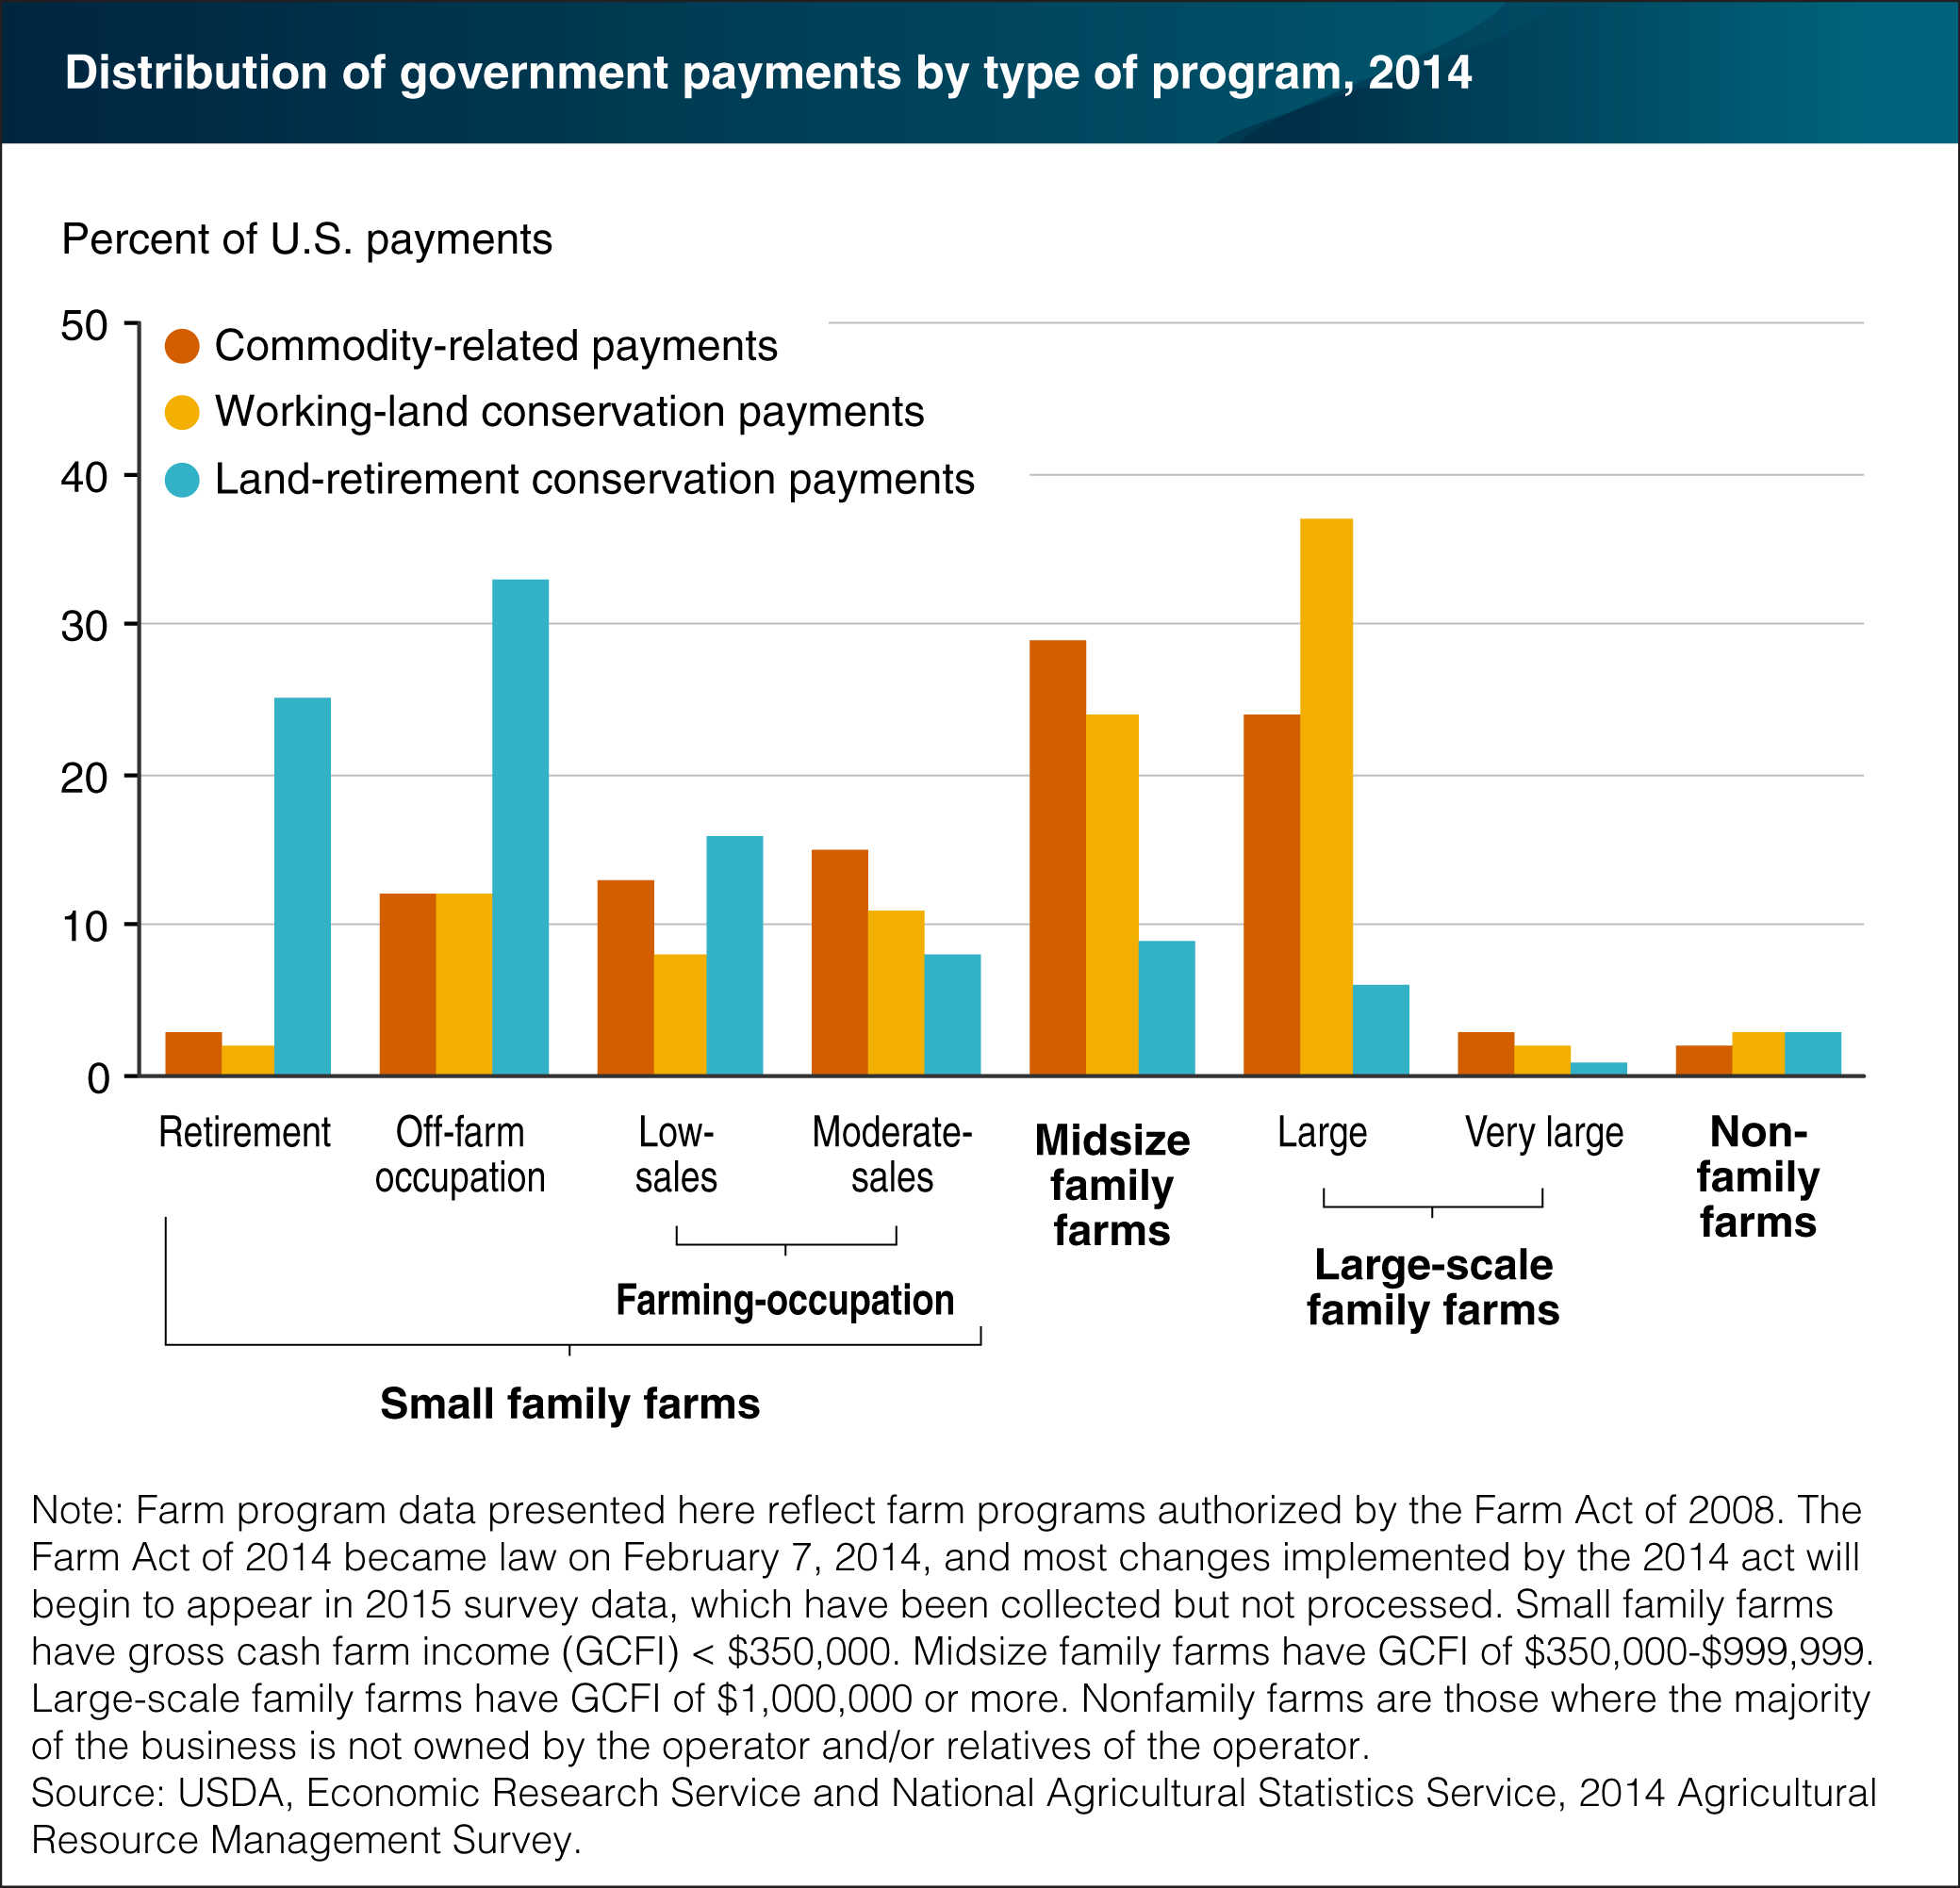
Farmers can receive government farm program payments from three broad categories of agricultural programs: commodity-related programs, working-land conservation programs, and land-retirement conservation programs. The distribution of payments in each category varies by farm type. In 2014, nearly 70 percent of commodity-related program payments went to moderate-sales, midsize, and large family farms, roughly proportional to their 80-percent share of acres in program-eligible crops. Midsize and large family farms together received about 60 percent of working-land payments that help farmers adopt conservation practices on agricultural land in production. Land-retirement programs pay farmers to remove environmentally sensitive land from production. Retirement, off-farm occupation, and low-sales farms received about three-fourths of these payments. Retired farmers and older farmers on low-sales farms may be more likely to take land out of production as they scale back their operations. Although government farm program payments can be important to the farms receiving them, 75 percent of farms in 2014 received no government payments. (These data summarize payments made in 2014. The Farm Act that was passed in 2014 introduced changes to commodity programs as part of a shift to greater reliance on crop insurance; most of those changes will be reflected in the source data beginning in 2015. Nevertheless, who receives particular government payments will continue to reflect farm and operator characteristics.) This chart is found in the ERS report America’s Diverse Family Farms: 2015 Edition.