
Percent of residents receiving SNAP benefits in 2015 varied across States, reflecting differences in need and program policies
- by Laura Tiehen
- 6/28/2016
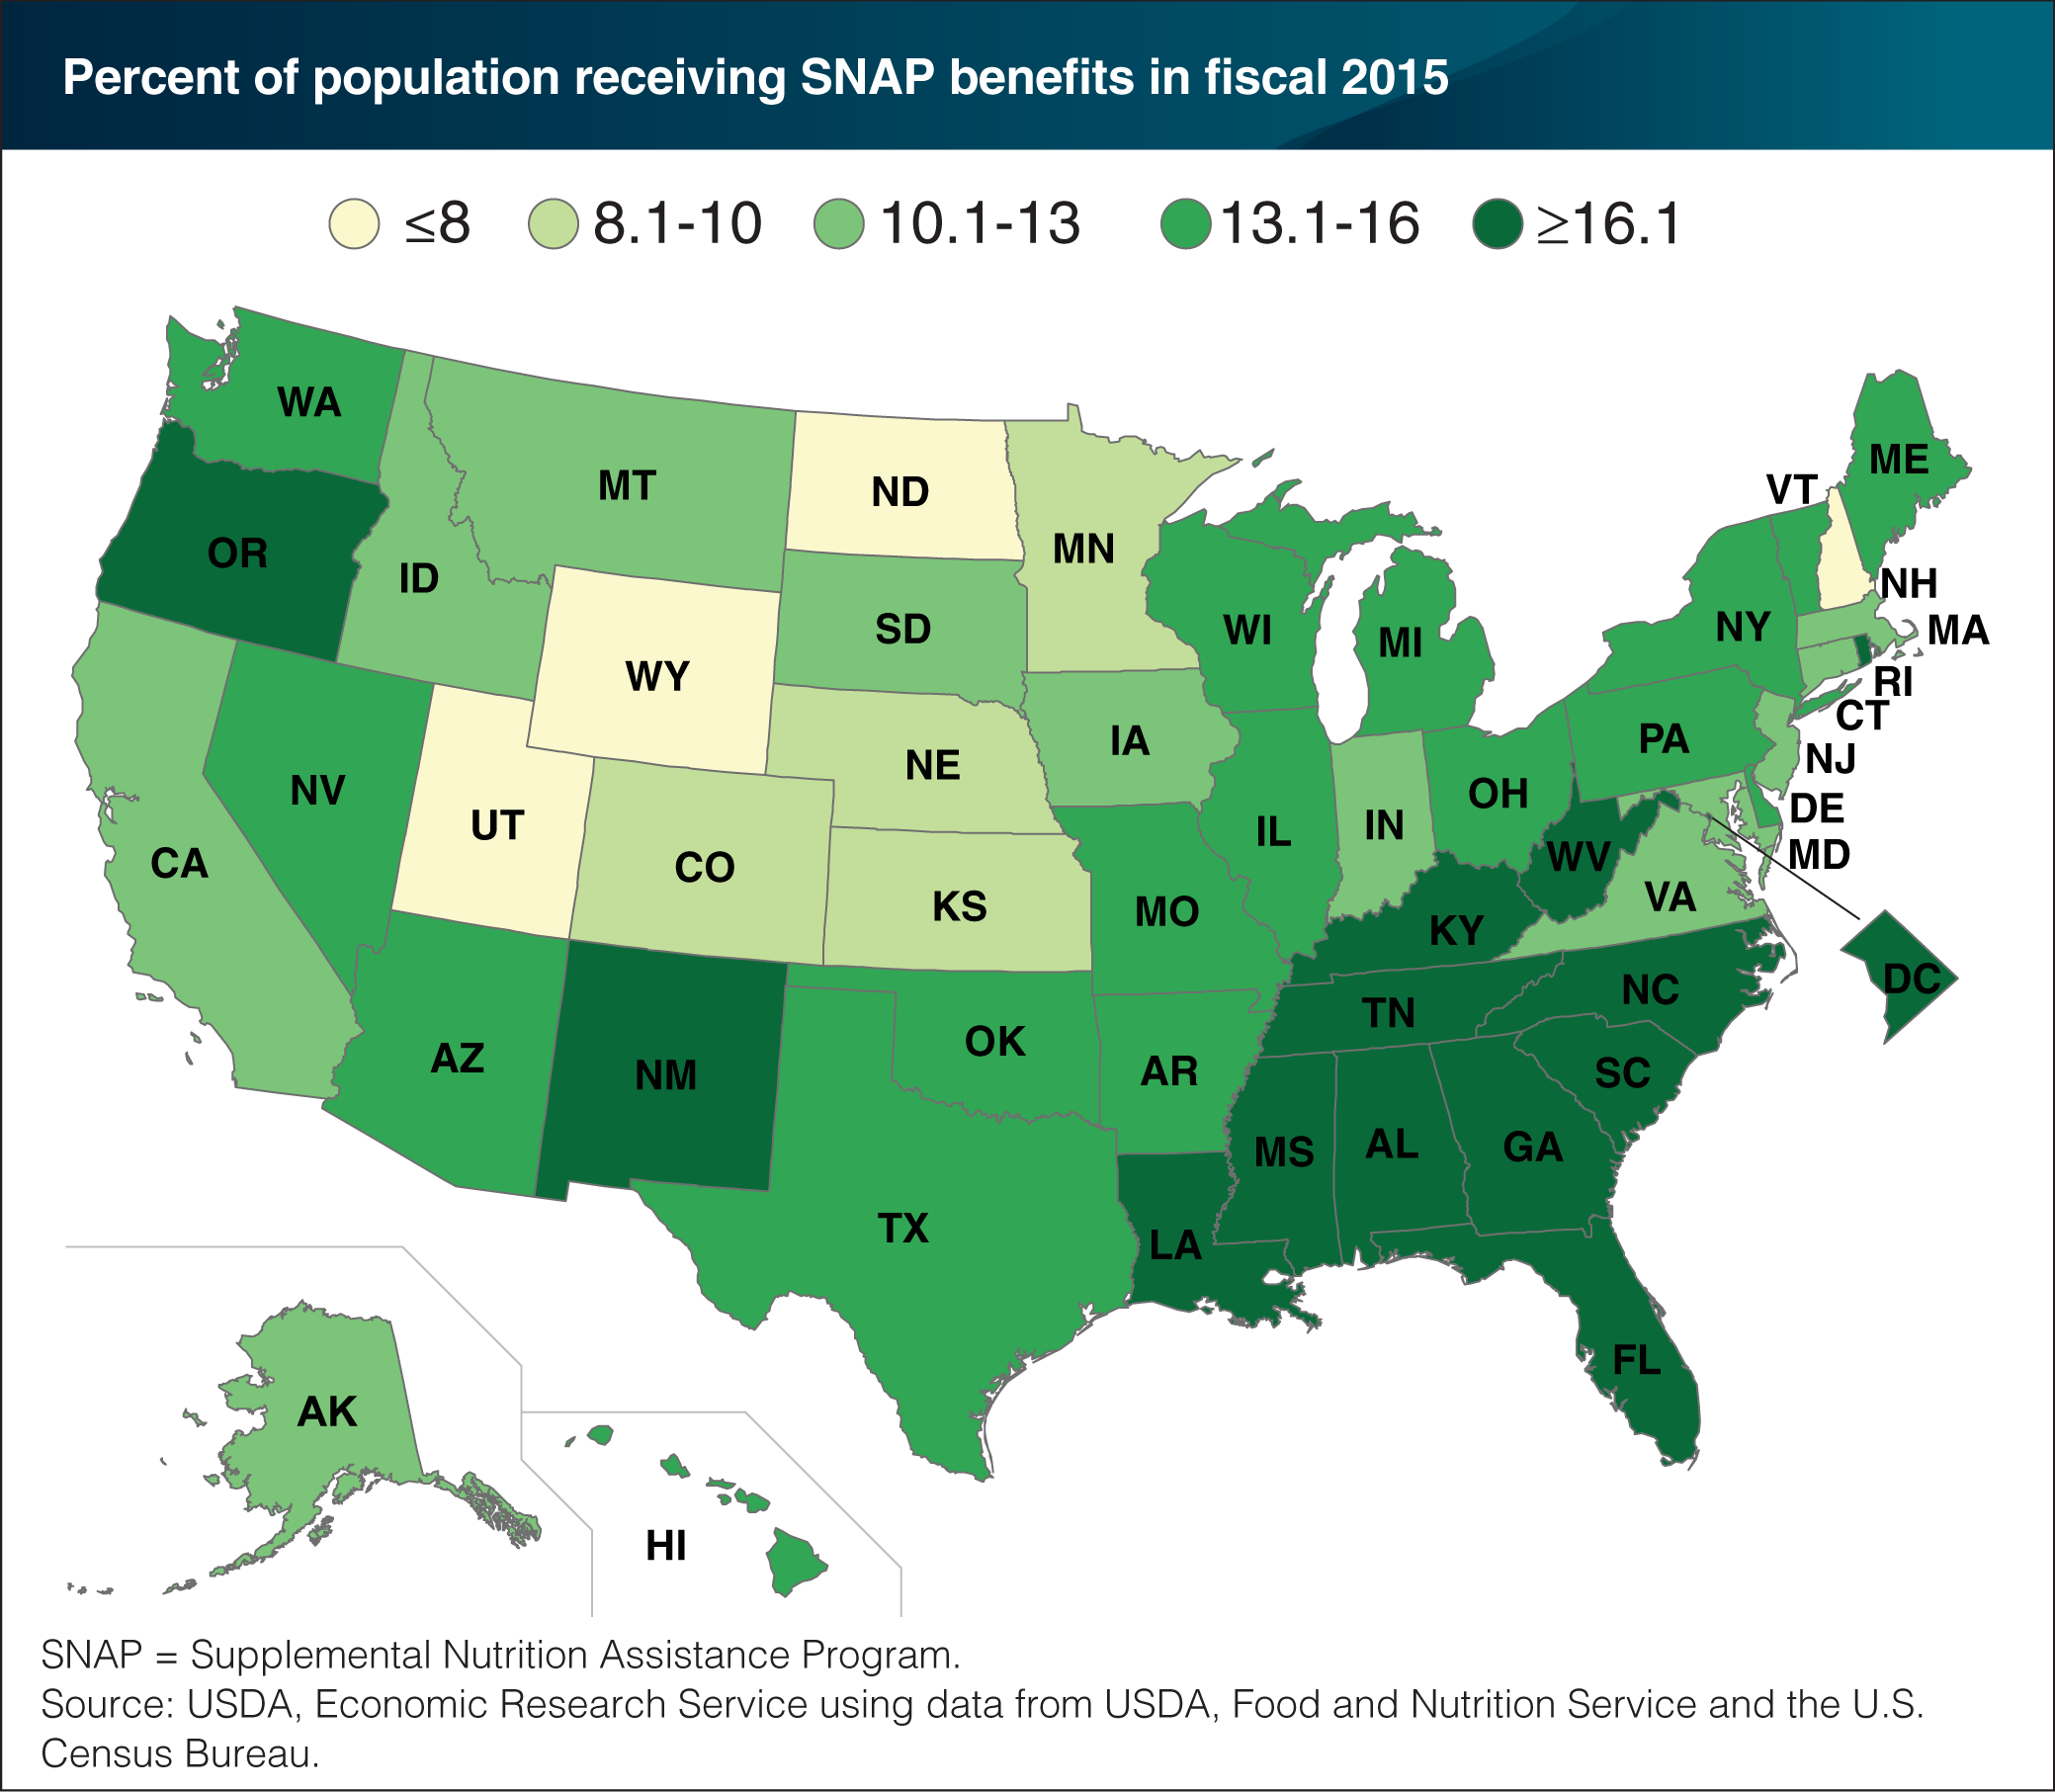
USDA’s Supplemental Nutrition Assistance Program (SNAP) served an average of 45.8 million people per month in fiscal 2015. The percent of Americans participating in the program declined from 15.0 percent in 2013 to 14.2 percent in 2015, marking the second consecutive year of a decline in the percent of the population receiving SNAP. Between 2014 and 2015, 39 States and the District of Columbia saw a decrease in the percent of residents receiving SNAP benefits, while 11 States experienced no change or small increases. The percent of State populations receiving SNAP benefits ranged from a low of 5.6 in Wyoming to a high of 21.7 in New Mexico, reflecting differences in need and in program policies. Southeastern States have a particularly high share of residents receiving SNAP benefits, with participation rates of 16.4 to 21.3 percent. Maine had the largest decline from 2014 to 2015, with the percent of residents receiving SNAP decreasing from 17.3 to 15.2 percent. This chart appears in the ERS data product, Ag and Food Statistics: Charting the Essentials, updated June 3, 2016.