
U.S. agricultural exports down, imports up, in 2016
- by Bryce Cooke
- 6/14/2016
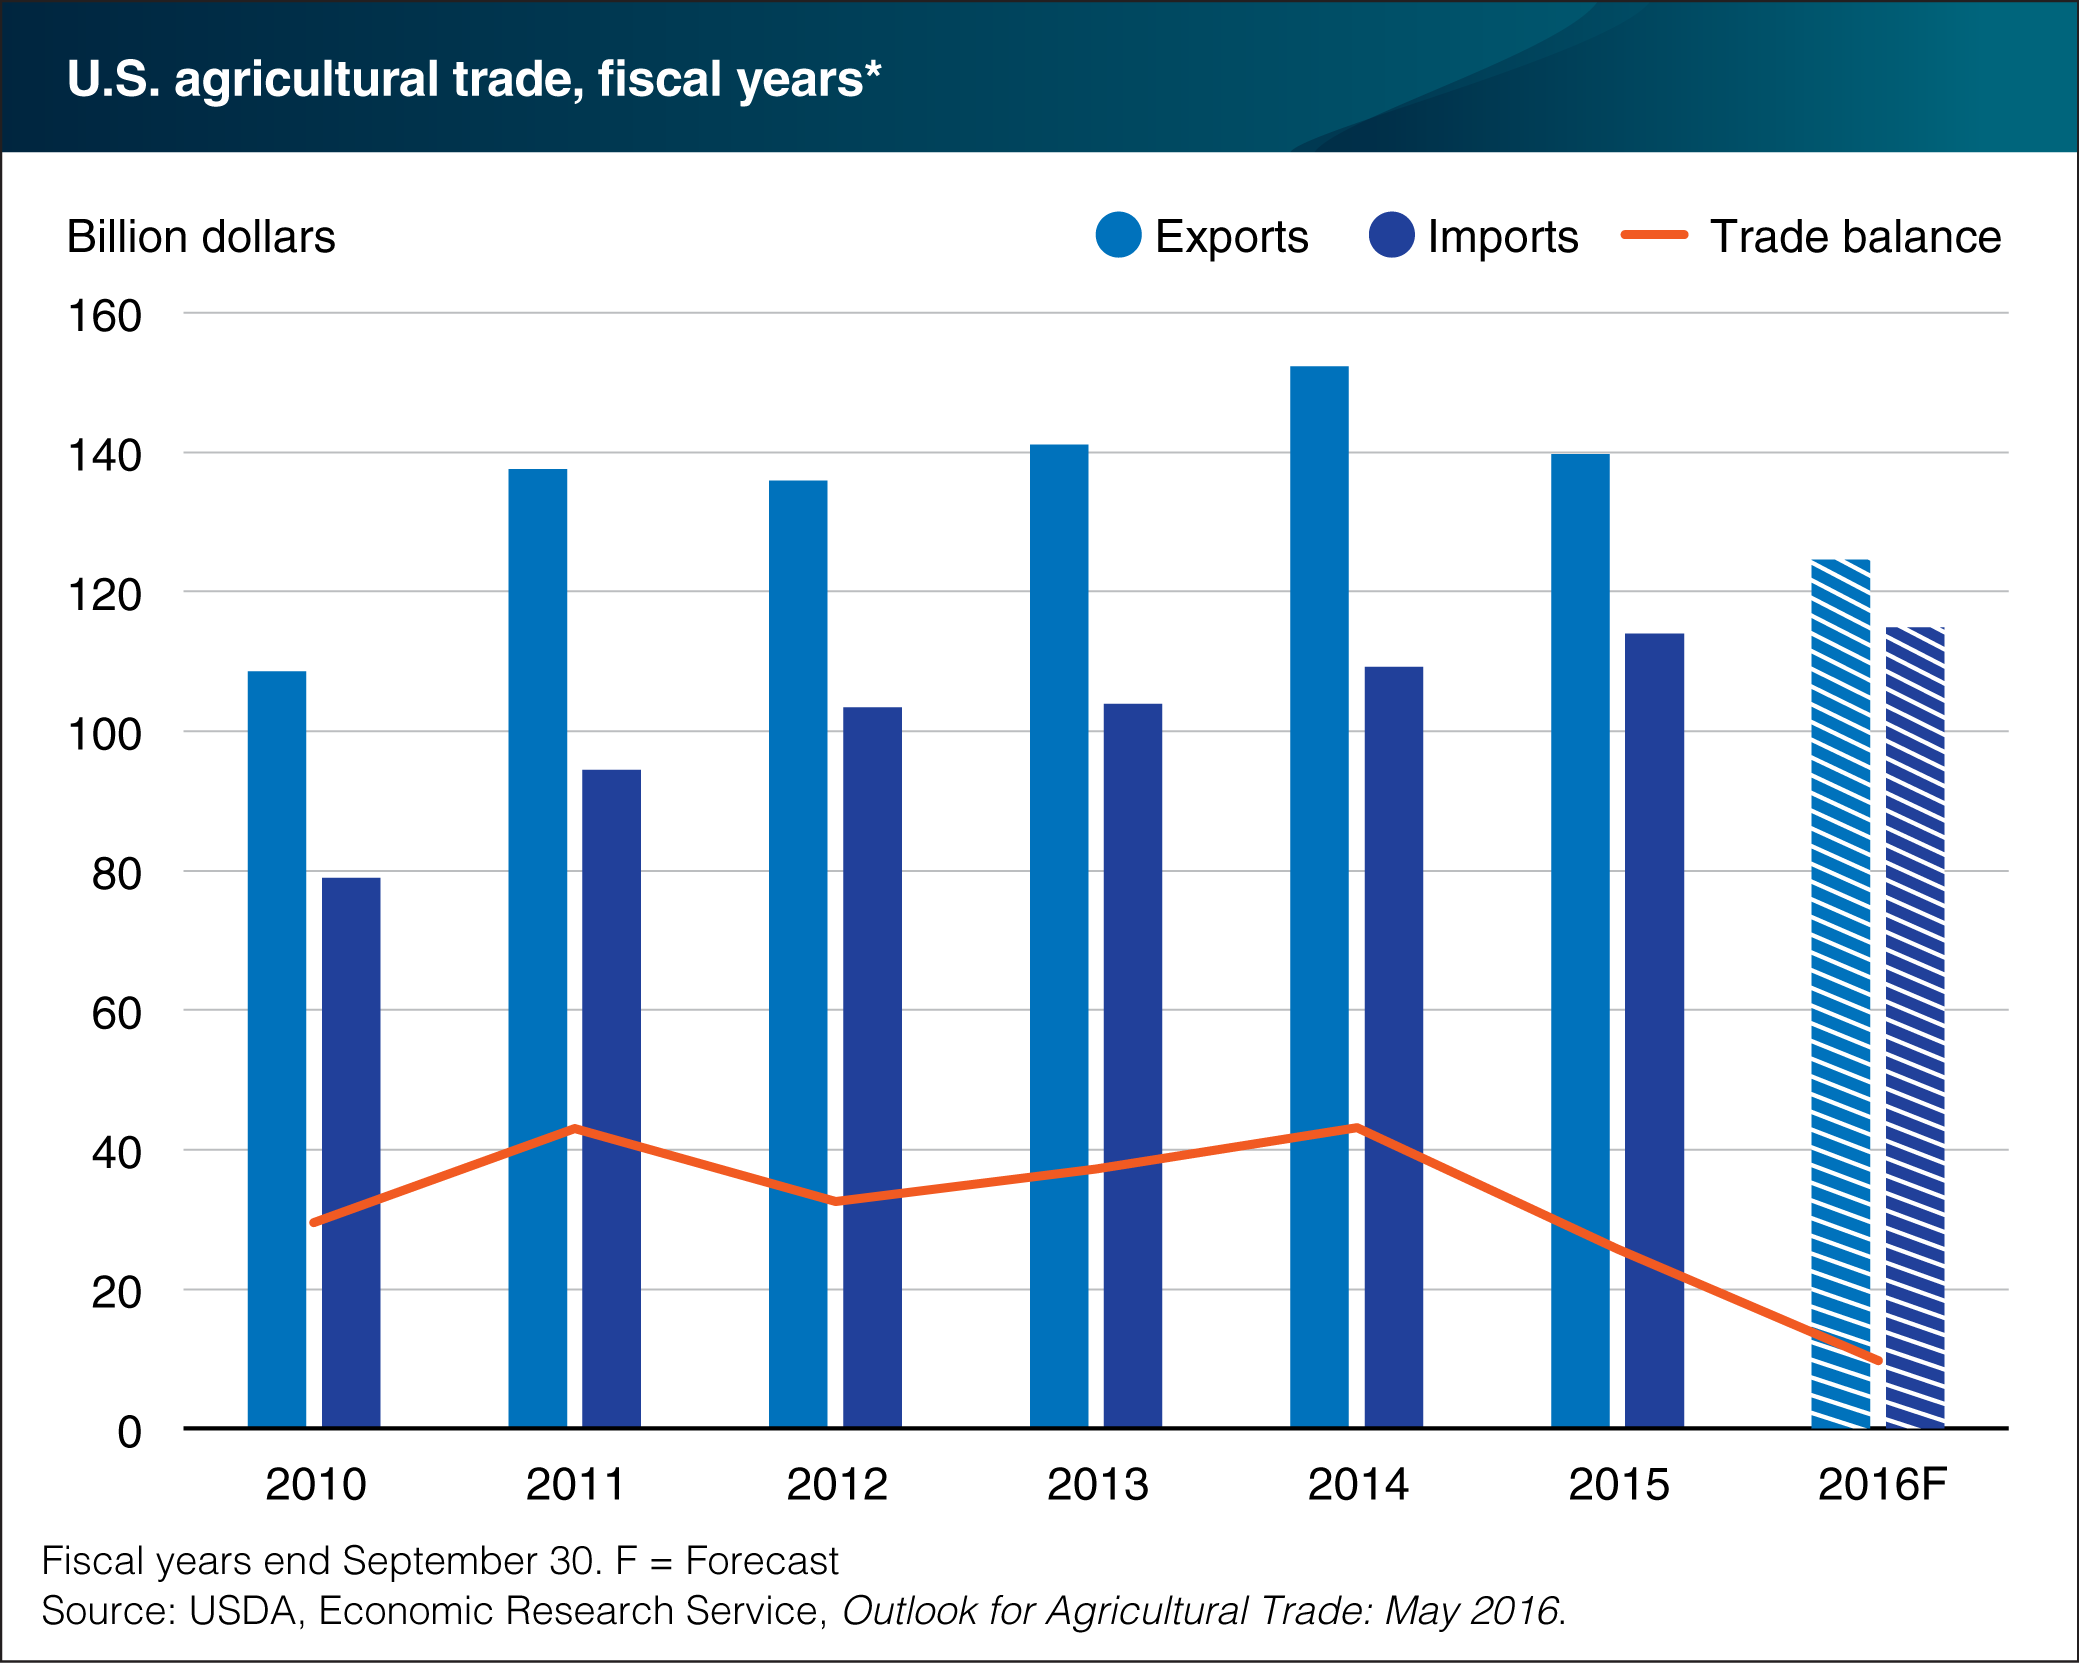
The value of U.S. agricultural exports is forecast at $124.5 billion for fiscal year (FY) 2016 (ending September 30), down $15.2 billion from FY 2015 and the second consecutive decline since a record $152.3 billion in agricultural exports was achieved in FY 2014. The declining export values over the past few years reflect a combination of lower commodity prices, a relatively weak global economy, and a strong U.S. dollar—which makes U.S. products more expensive in foreign currency terms. The value of imports, on the other hand, continues to grow and is forecast to reach a record $114.8 billion this year, up $800 million from FY 2015. With lower exports and higher imports, the FY 2016 agricultural trade balance is forecast to fall to $9.7 billion, down $16.0 billion from last year and the lowest since FY 2006. This chart is from the ERS report Outlook for U.S. Agricultural Trade: May 2016.