
Six foodborne pathogens rank high on per case costs and/or total economic burden
- by Sandra Hoffmann
- 6/13/2016
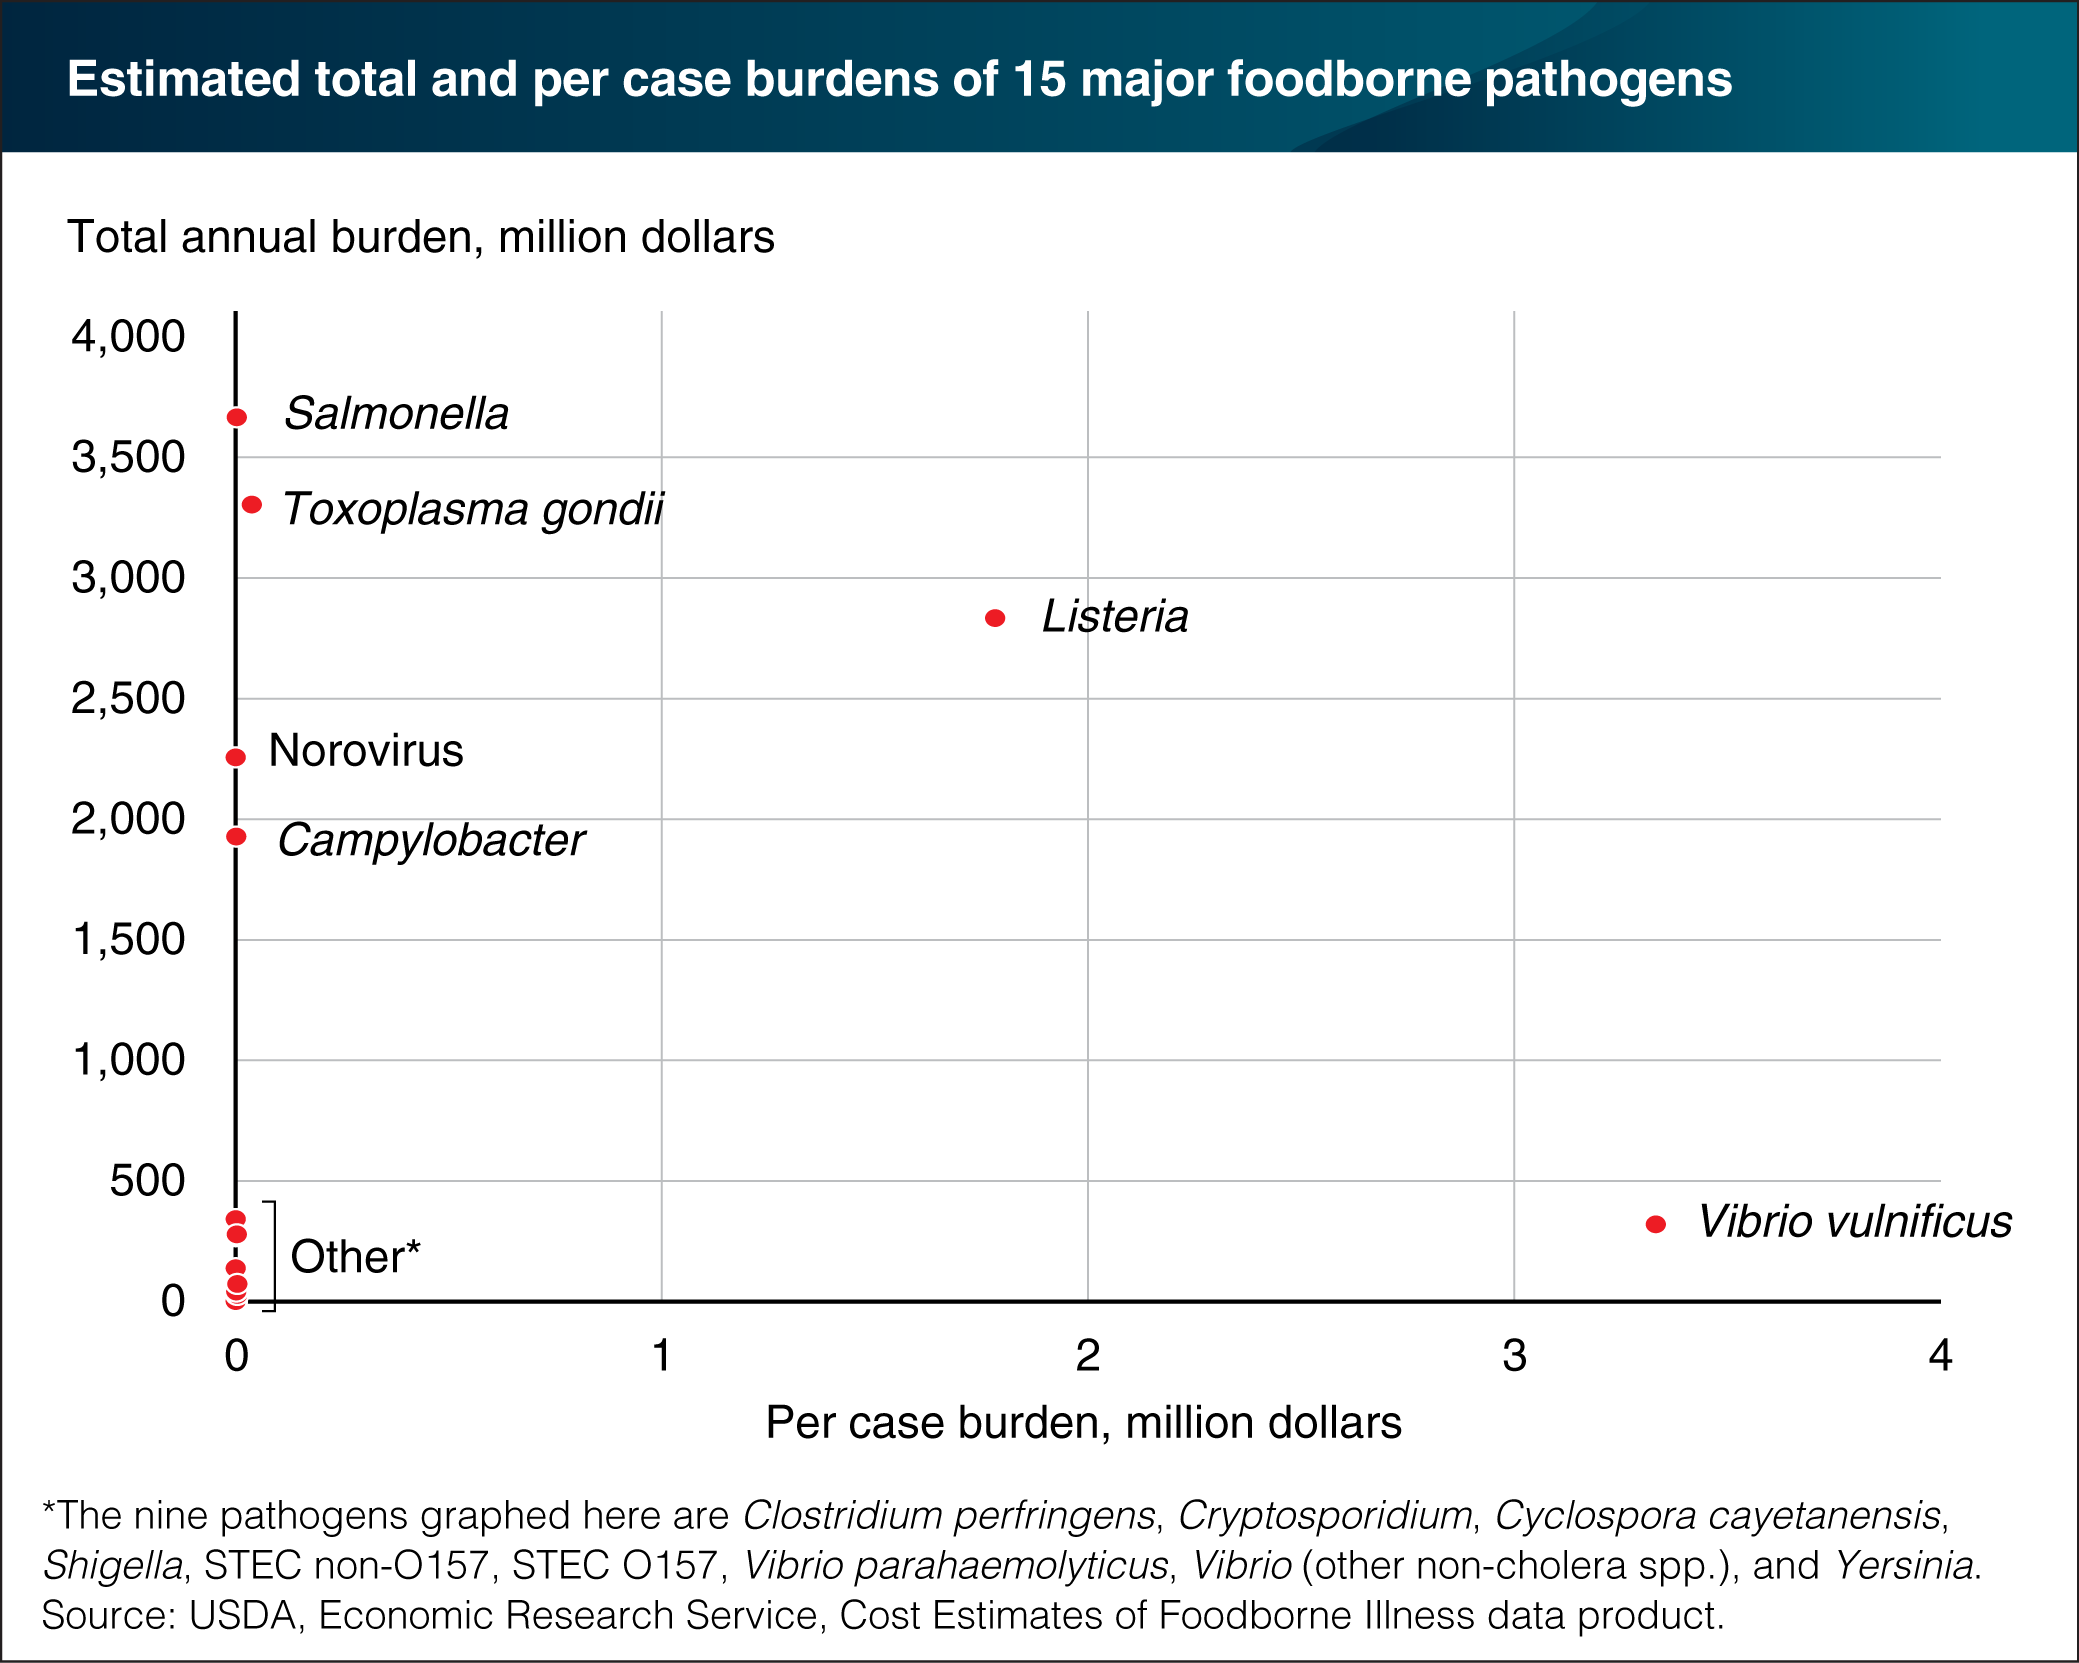
Both the total economic burden of a disease and the severity of individual cases are important indicators of how serious the disease is. ERS estimates the aggregate economic burden of 15 major foodborne illnesses at over $15 billion per year. But these 15 illnesses—and the pathogens that cause them—have very different total and per case impacts. For example, Salmonella’s total annual economic burden ($3.7 billion) is over 10 times Vibrio vulnificus’s ($320 million). But the per case burden of Vibrio vulnificus ($3.3 million) is almost 1,000 times that of a Salmonella case ($3,568). High per case burdens are the result of severe health outcomes, such as birth defects, renal failure, and death. Total annual economic burden reflects per case costs and how many people are sickened by the pathogens each year. Toxoplasma gondii ranks second behind Salmonella in terms of total economic burden and has a per case cost of $38,114. Listeria ranks high on both a per case basis ($1.8 million) and a total annual burden basis ($2.8 billion). Like Salmonella, Norovirus and Campylobacter also stand out as having high total impacts, though relatively lower per case costs. The statistics for this table are from ERS’s Cost Estimates of Foodborne Illnesses data product, March 2016.