
Peanut and tree nut consumption rises with income
- by Biing-Hwan Lin
- 4/13/2016
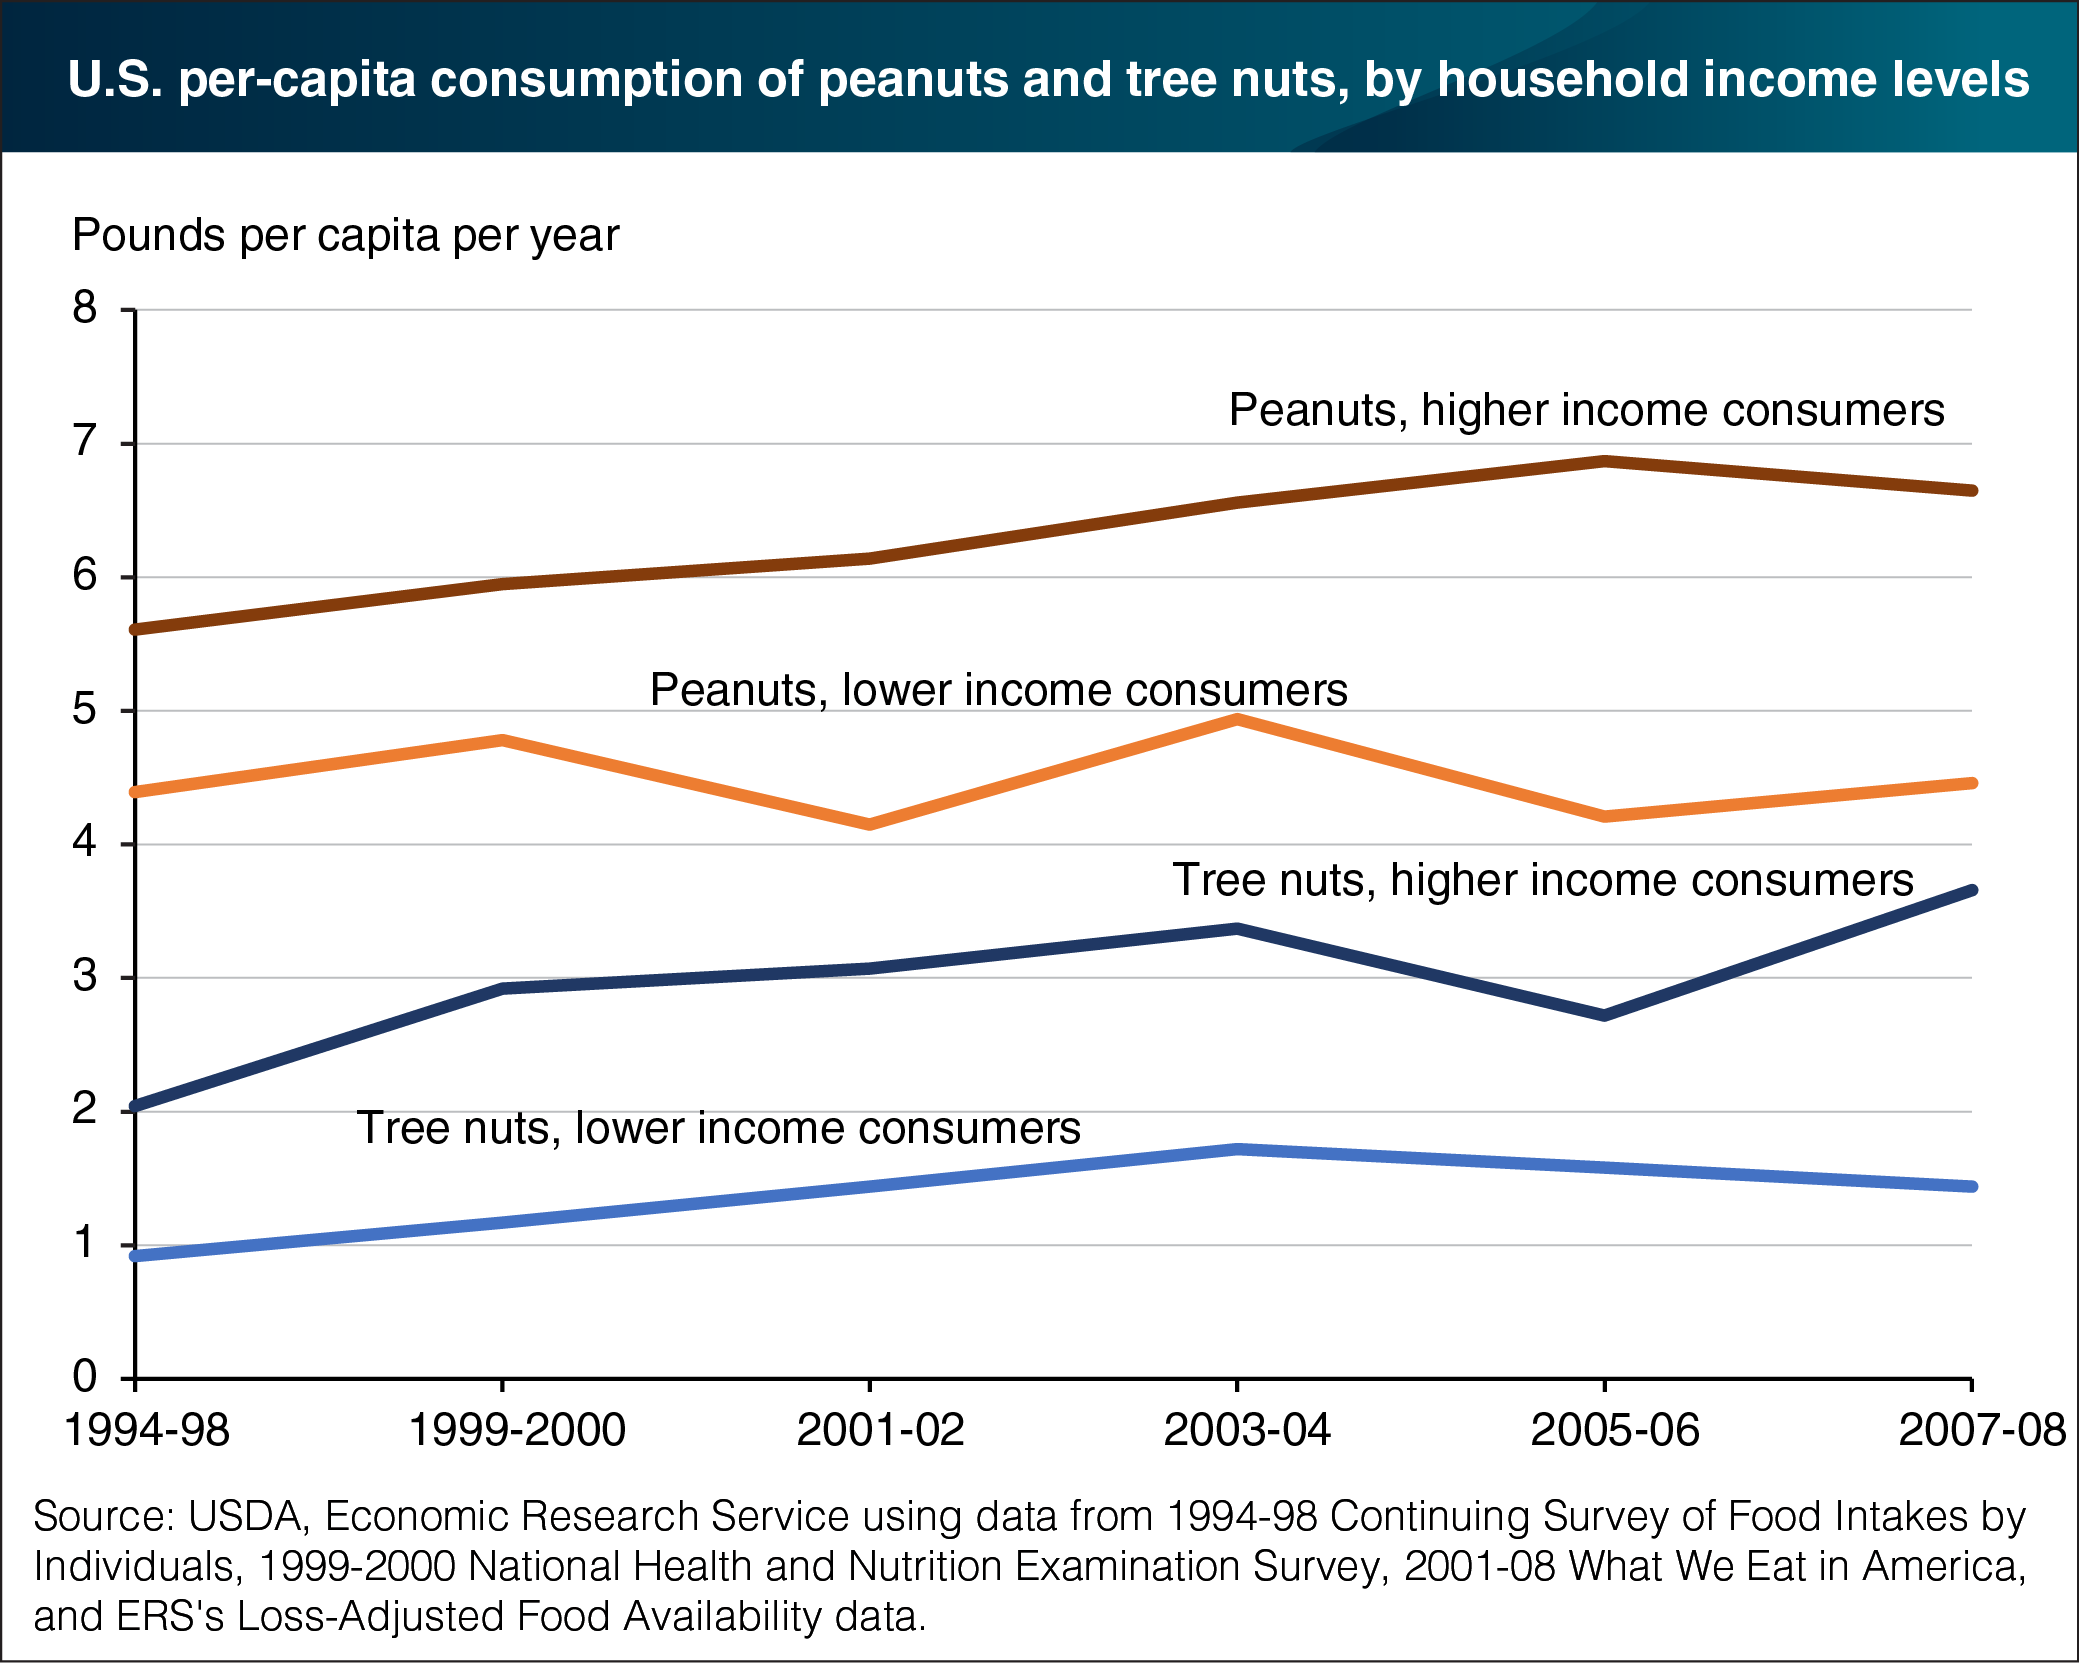
A recent linking of ERS’s loss-adjusted food availability data with intake surveys from 1994-2008 reveals that consumers with incomes above 185 percent of the Federal poverty ($21,200 for a family of four in 2008) consistently consumed greater quantities of nuts than consumers with lower incomes, and the gap was higher in more recent years. Nut allergies and consumers’ perceptions about the cost of peanuts and tree nuts may play a role in consumption patterns. In 2007-08, higher income Americans ate 6.7 pounds of peanuts per person per year and 3.7 pounds of tree nuts, compared with the 4.5 pounds of peanuts and 1.4 pounds of tree nuts consumed by lower income consumers. Children consumed more peanuts per person than adults during 1994-98, but since then, adults have consumed more peanuts than children. Adults ate more tree nuts than children did in all survey years, and non-Hispanic Whites consumed more peanuts and tree nuts than non-Hispanic Blacks and Hispanics. This chart and similar information on 60 other food commodities can be found in the ERS report, U.S. Food Commodity Consumption Broken Down by Demographics, 1994-2008, released on March 30, 2016.