
Milk production and inventories continue shifting to larger herds
- by James M. MacDonald
- 3/11/2016
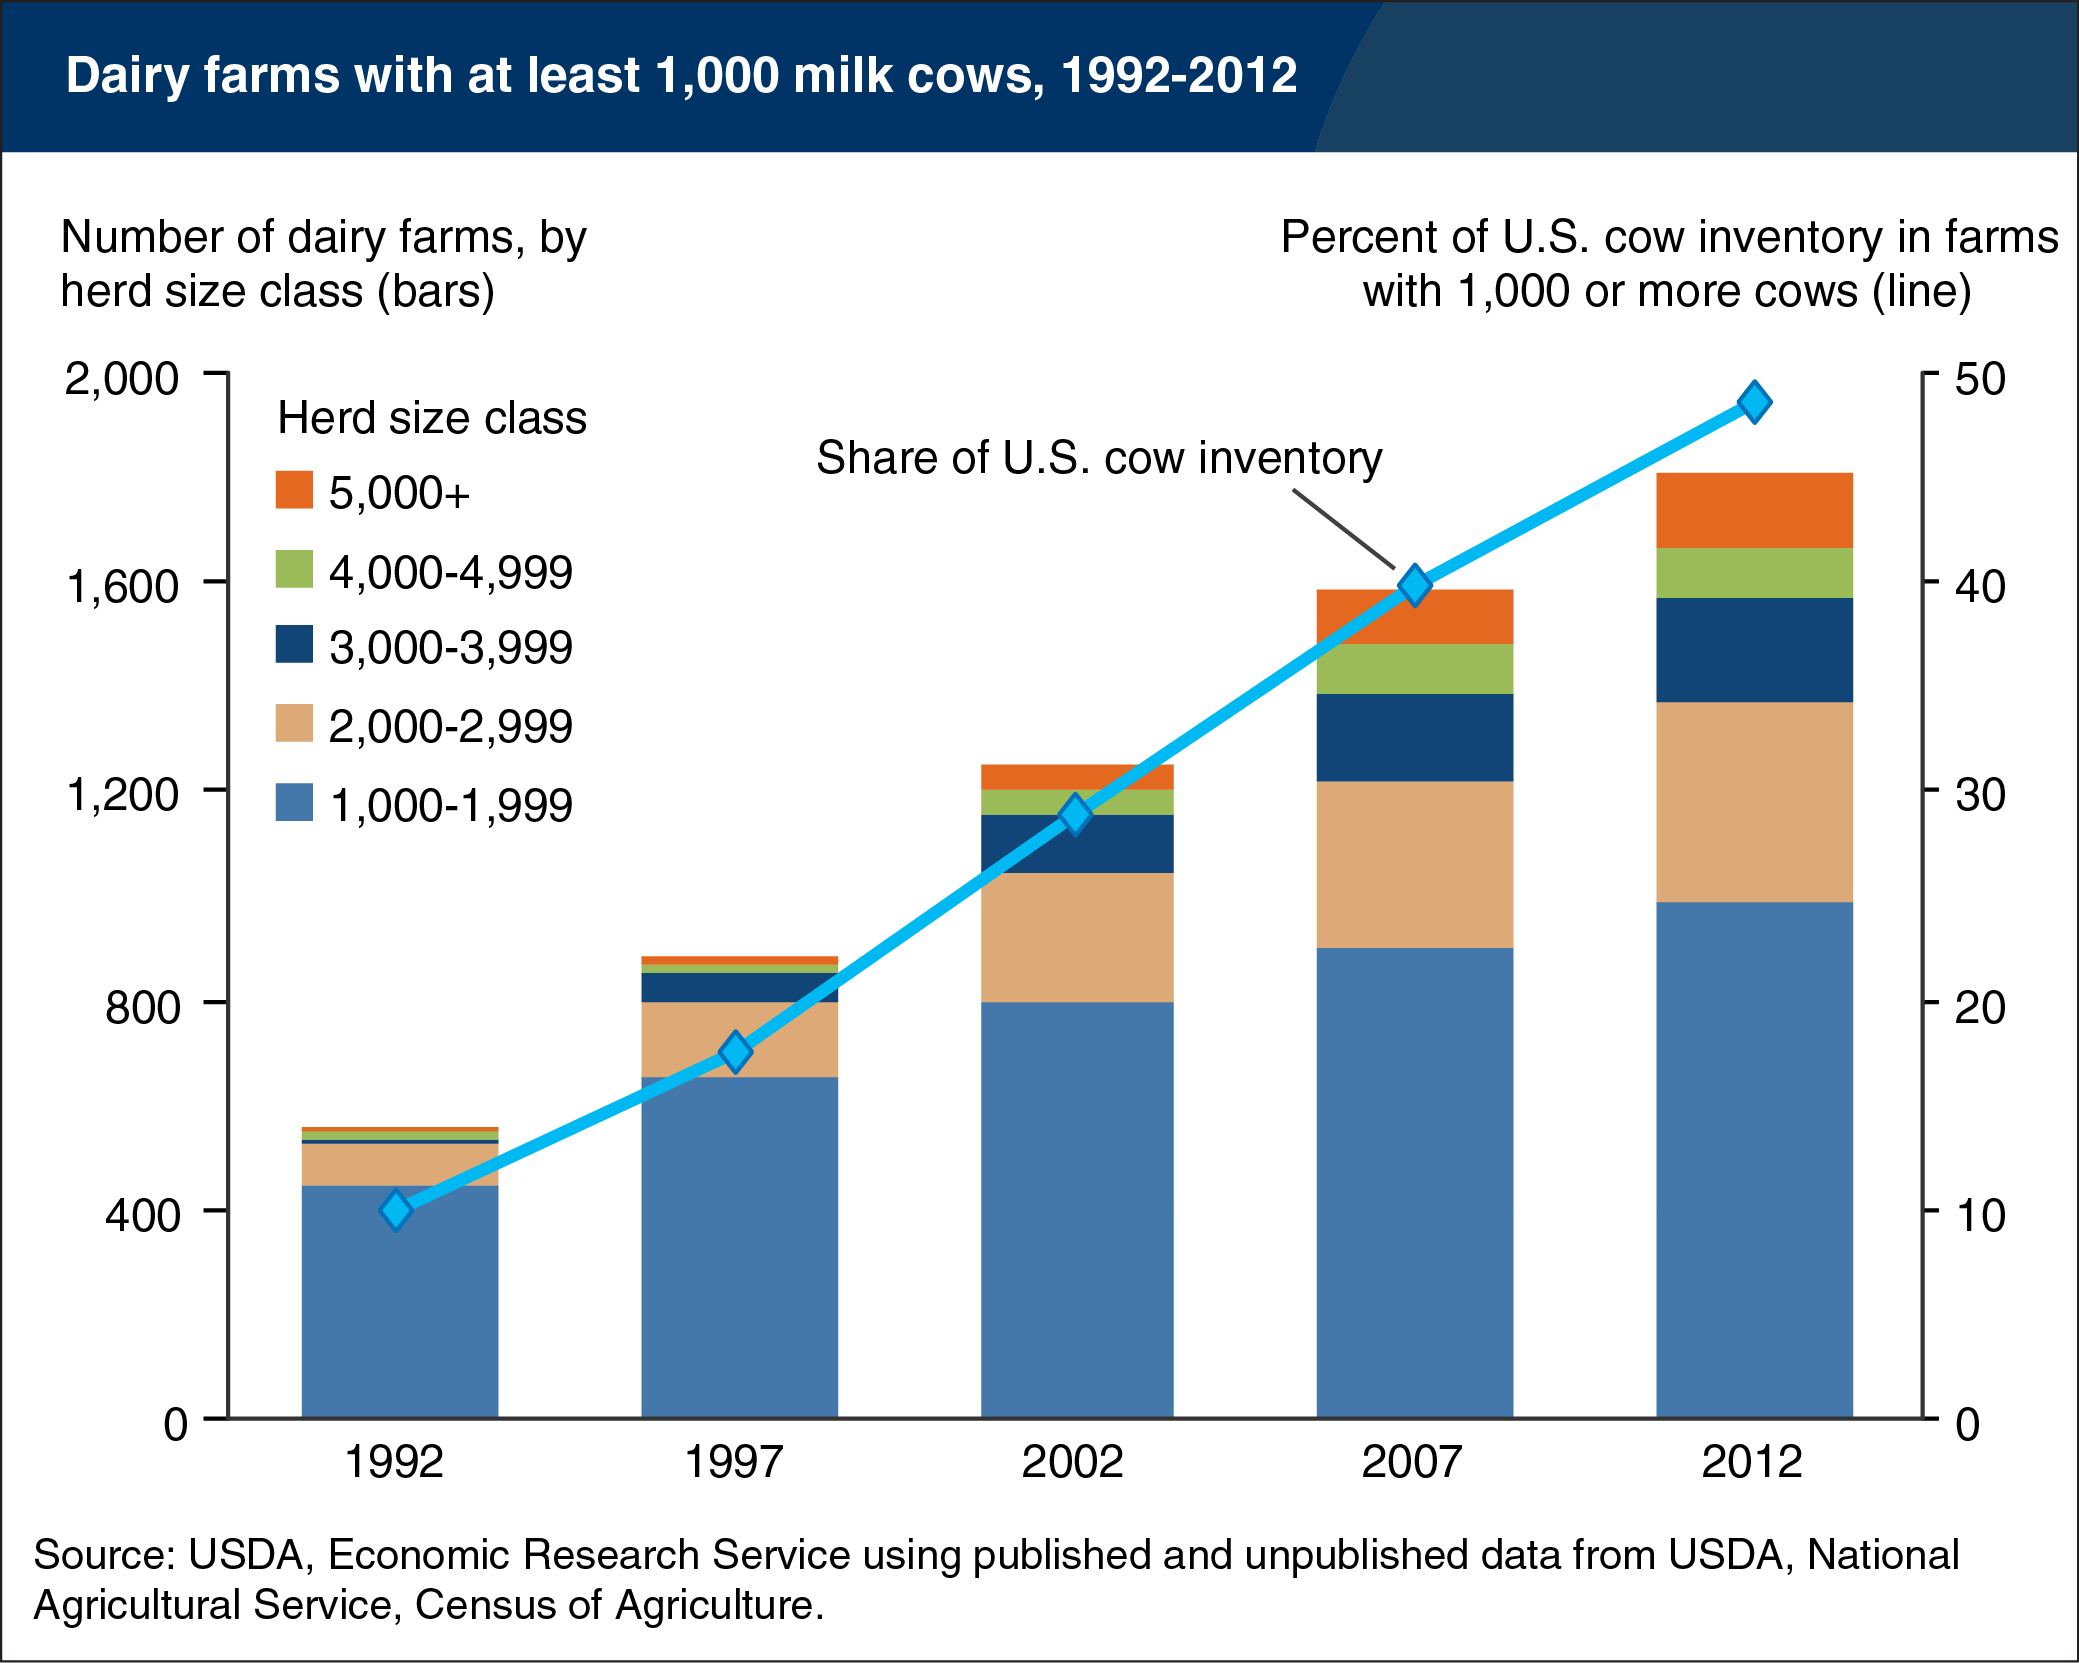
Two decades ago, most milk came from farms with fewer than 150 cows, on which a farm family handled milking, herd management, and crop production for feed. Today, while the United States still has many herds of 50 to 100 cows, most cows and milk production have moved to much larger farms, which are usually still owned and operated by families, but rely on hired labor for most farm tasks. Farms with milking herds of at least 1,000 cows accounted for nearly half of all cows in 2012, up from 10 percent of all cows in 1992. Producers continued to increase herd size in that period; there were 17 farms with herds of 4,000 or more cows in 1992, compared to 95 farms in 2002 and 234 in 2012. Costs are an important reason behind the shift, as production costs appear to be substantially lower, on average, on larger farms. The data underlying this chart are available in the ERS report, Changing Structure, Financial Risks, and Government Policy for the U.S. Dairy Industry, March 2016.