
Household income from farming varies by farm business type
- by Daniel Prager
- 2/19/2016
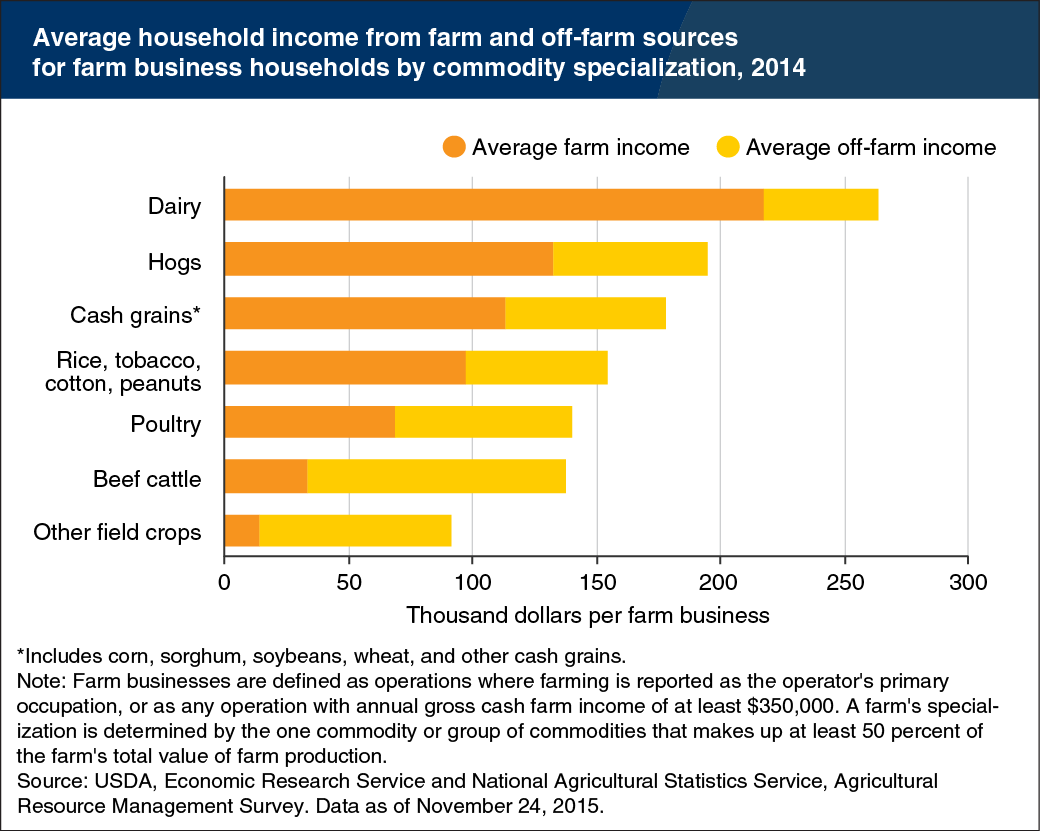
On average, households associated with farm businesses supplement farm income with income from off-farm sources. However, across different types of farm operations, the extent that off-farm income supplements farm income varies considerably. For example, with its extensive and ongoing time demands, managing a dairy farm rarely permits an operator to work many hours off-farm and is a main reason why farm income constitutes over four-fifths of these households’ total income. In 2014, households with farm businesses specializing in dairy and hogs had the highest average total household income (combining income from farm and off-farm sources), and the highest shares of household income derived from farming, followed by farms specializing in cash grains (corn, soybeans, sorghum, or wheat). Farm households with businesses specializing in beef cattle, other field crops, and poultry had the largest shares of average household income derived from off-farm activities. This chart is a variation of one found in the Farm Household Well-being topic page, and based on data available in ARMS Farm Financial and Crop Production Practices.