
Many U.S. agricultural goods shipped to the European Union face high tariffs
- by Jayson Beckman
- 11/13/2015
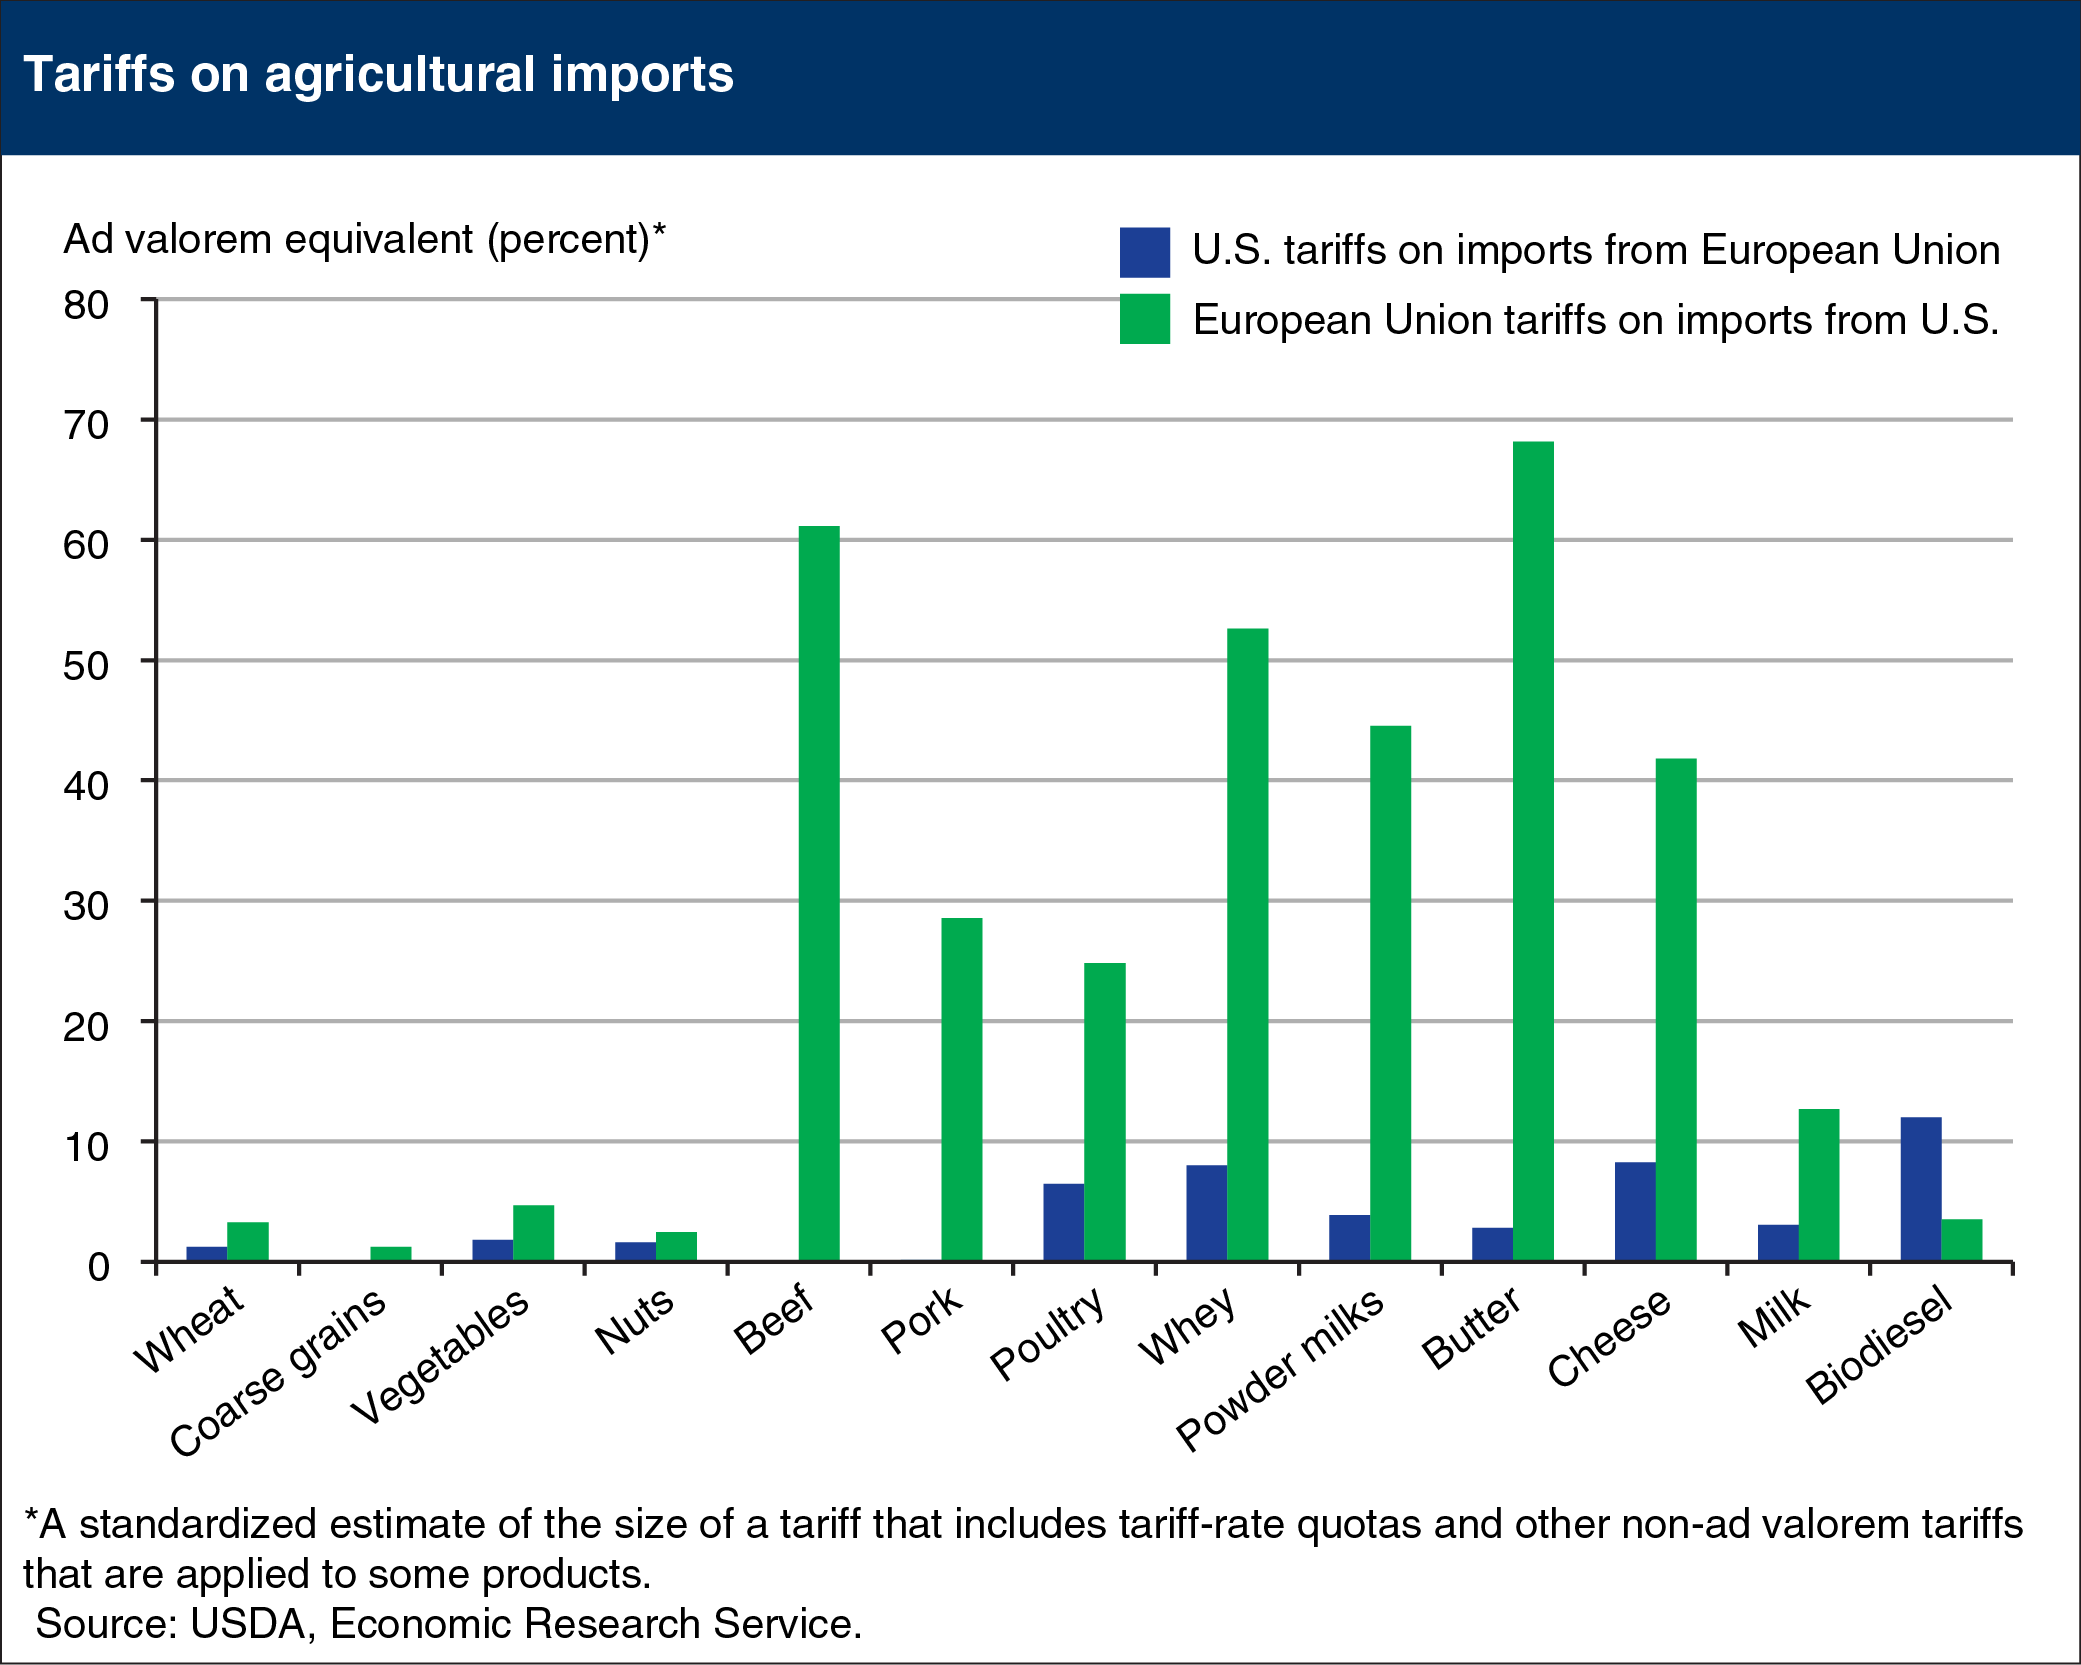
The United States and the European Union (EU) are major producers of most agricultural goods and account for a significant share of global agricultural trade. While overall trade between the United States and the EU has grown over time, agricultural trade has decreased, due in part to the relatively high trade barriers facing U.S. agricultural exports to the EU. While the simple average applied tariff for all goods is estimated at 3.5 percent for EU exports to the United States and 5.5 percent for U.S. exports to the EU, agricultural commodities tend to face larger tariffs; the simple average tariffs for agricultural goods are 4.7 percent for EU exports to the United States and 13.7 percent for U.S. exports to the EU. In addition, many agricultural goods face tariff-rate quotas (TRQs) that allow the tariff to change depending on the quantity imported. This chart is from the ERS report, Agriculture in the Transatlantic Trade and Investment Partnership: Tariffs, Tariff-Rate Quotas and Non-Tariff Measures.
We’d welcome your feedback!
Would you be willing to answer a few quick questions about your experience?