
Nonmetro job growth accelerates in 2015, but is unevenly distributed
- by Thomas Hertz, Timothy Parker and Lorin Kusmin
- 9/4/2015
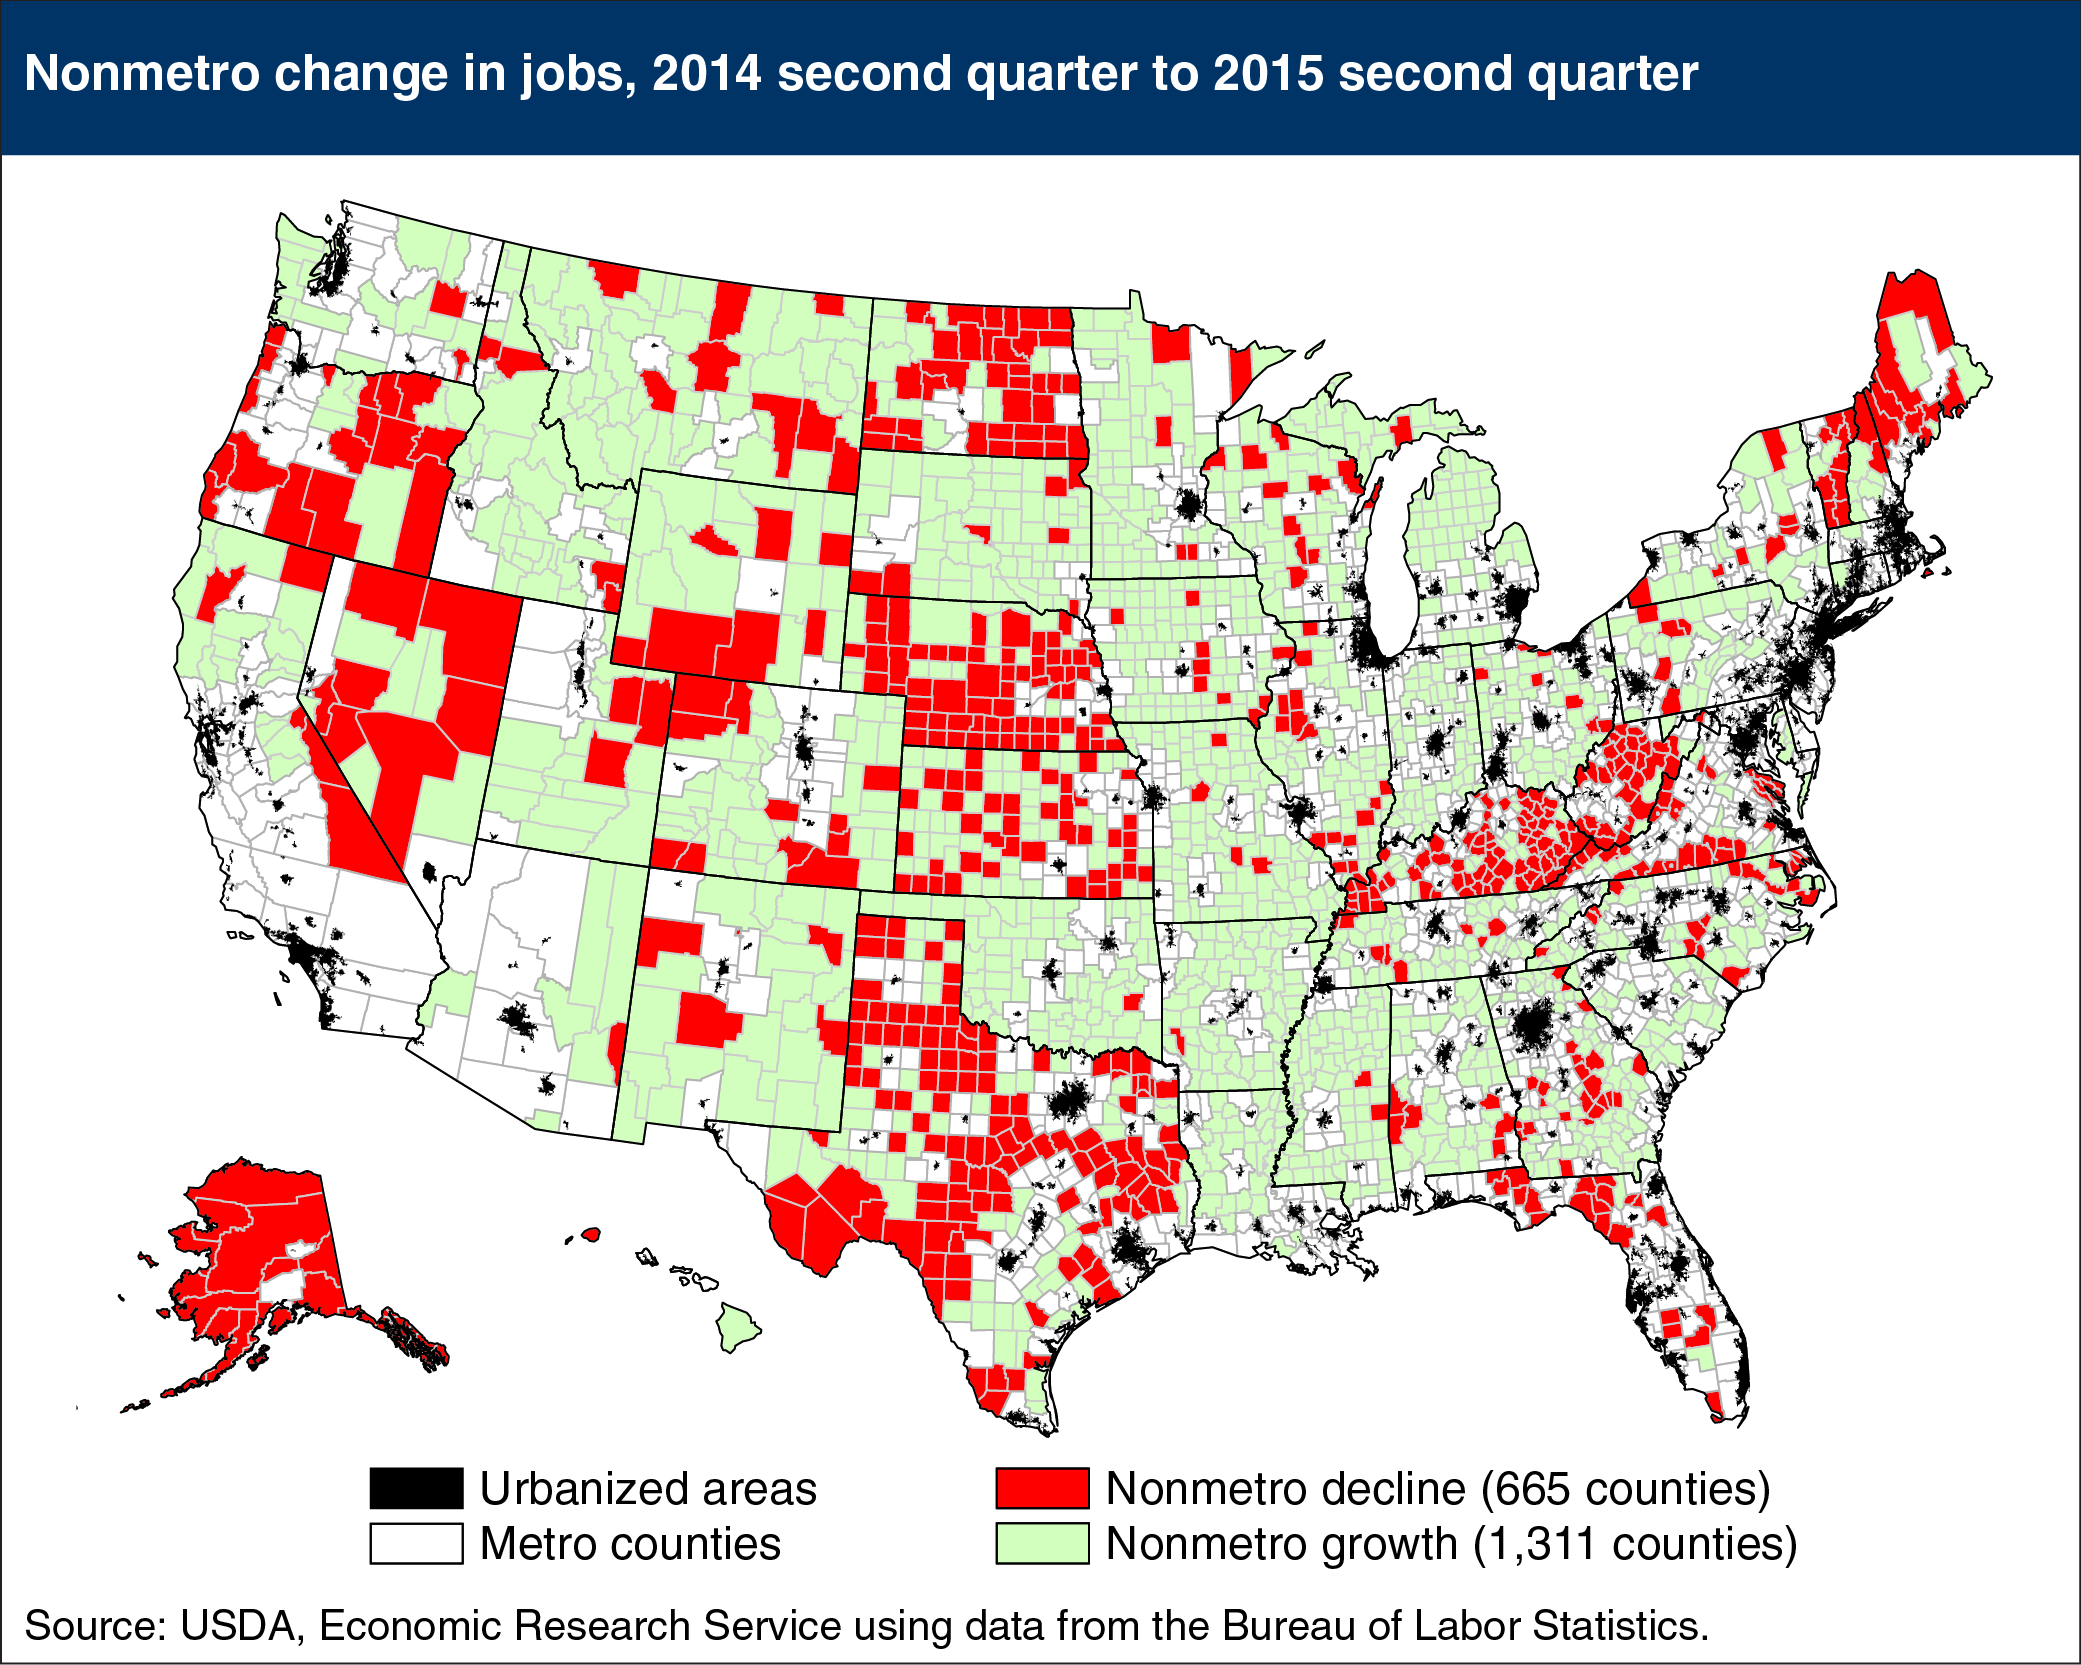
The number of rural (nonmetro) jobs rose by 239,000 (1.2 percent) between the second quarters of 2014 and 2015, more than double the rate of growth over the prior year. Rural job growth still lags behind the rate of growth in metro areas, which saw the number of jobs rise by 1.8 percent over this period. Moreover, while the number of jobs in urban areas now exceeds the peak levels recorded prior to the Great Recession in 2007, rural employment is still well below its pre-recession peak. Rural job growth was unevenly distributed; some 1311 rural counties saw no change or an increase in jobs (ranging up to 69 percent growth), but 665 experienced job declines, with the largest decline being 19 percent. Rural counties in several oil and gas-producing states, such as Texas, Kansas, and North Dakota, which had generally experienced job growth between 2013 and 2014, experienced declines in 2014-15. The vast majority (88 percent) of rural counties in the block of Southern States stretching from Arkansas to Georgia experienced job growth, whereas, in 2013-14, 71 percent of these rural counties had employment losses. This map updates one found in the ERS report, Rural America At a Glance, 2014 Edition.