
U.S. rice production is projected to decline 6 percent in 2015
- by Economic Research Service
- 8/6/2015
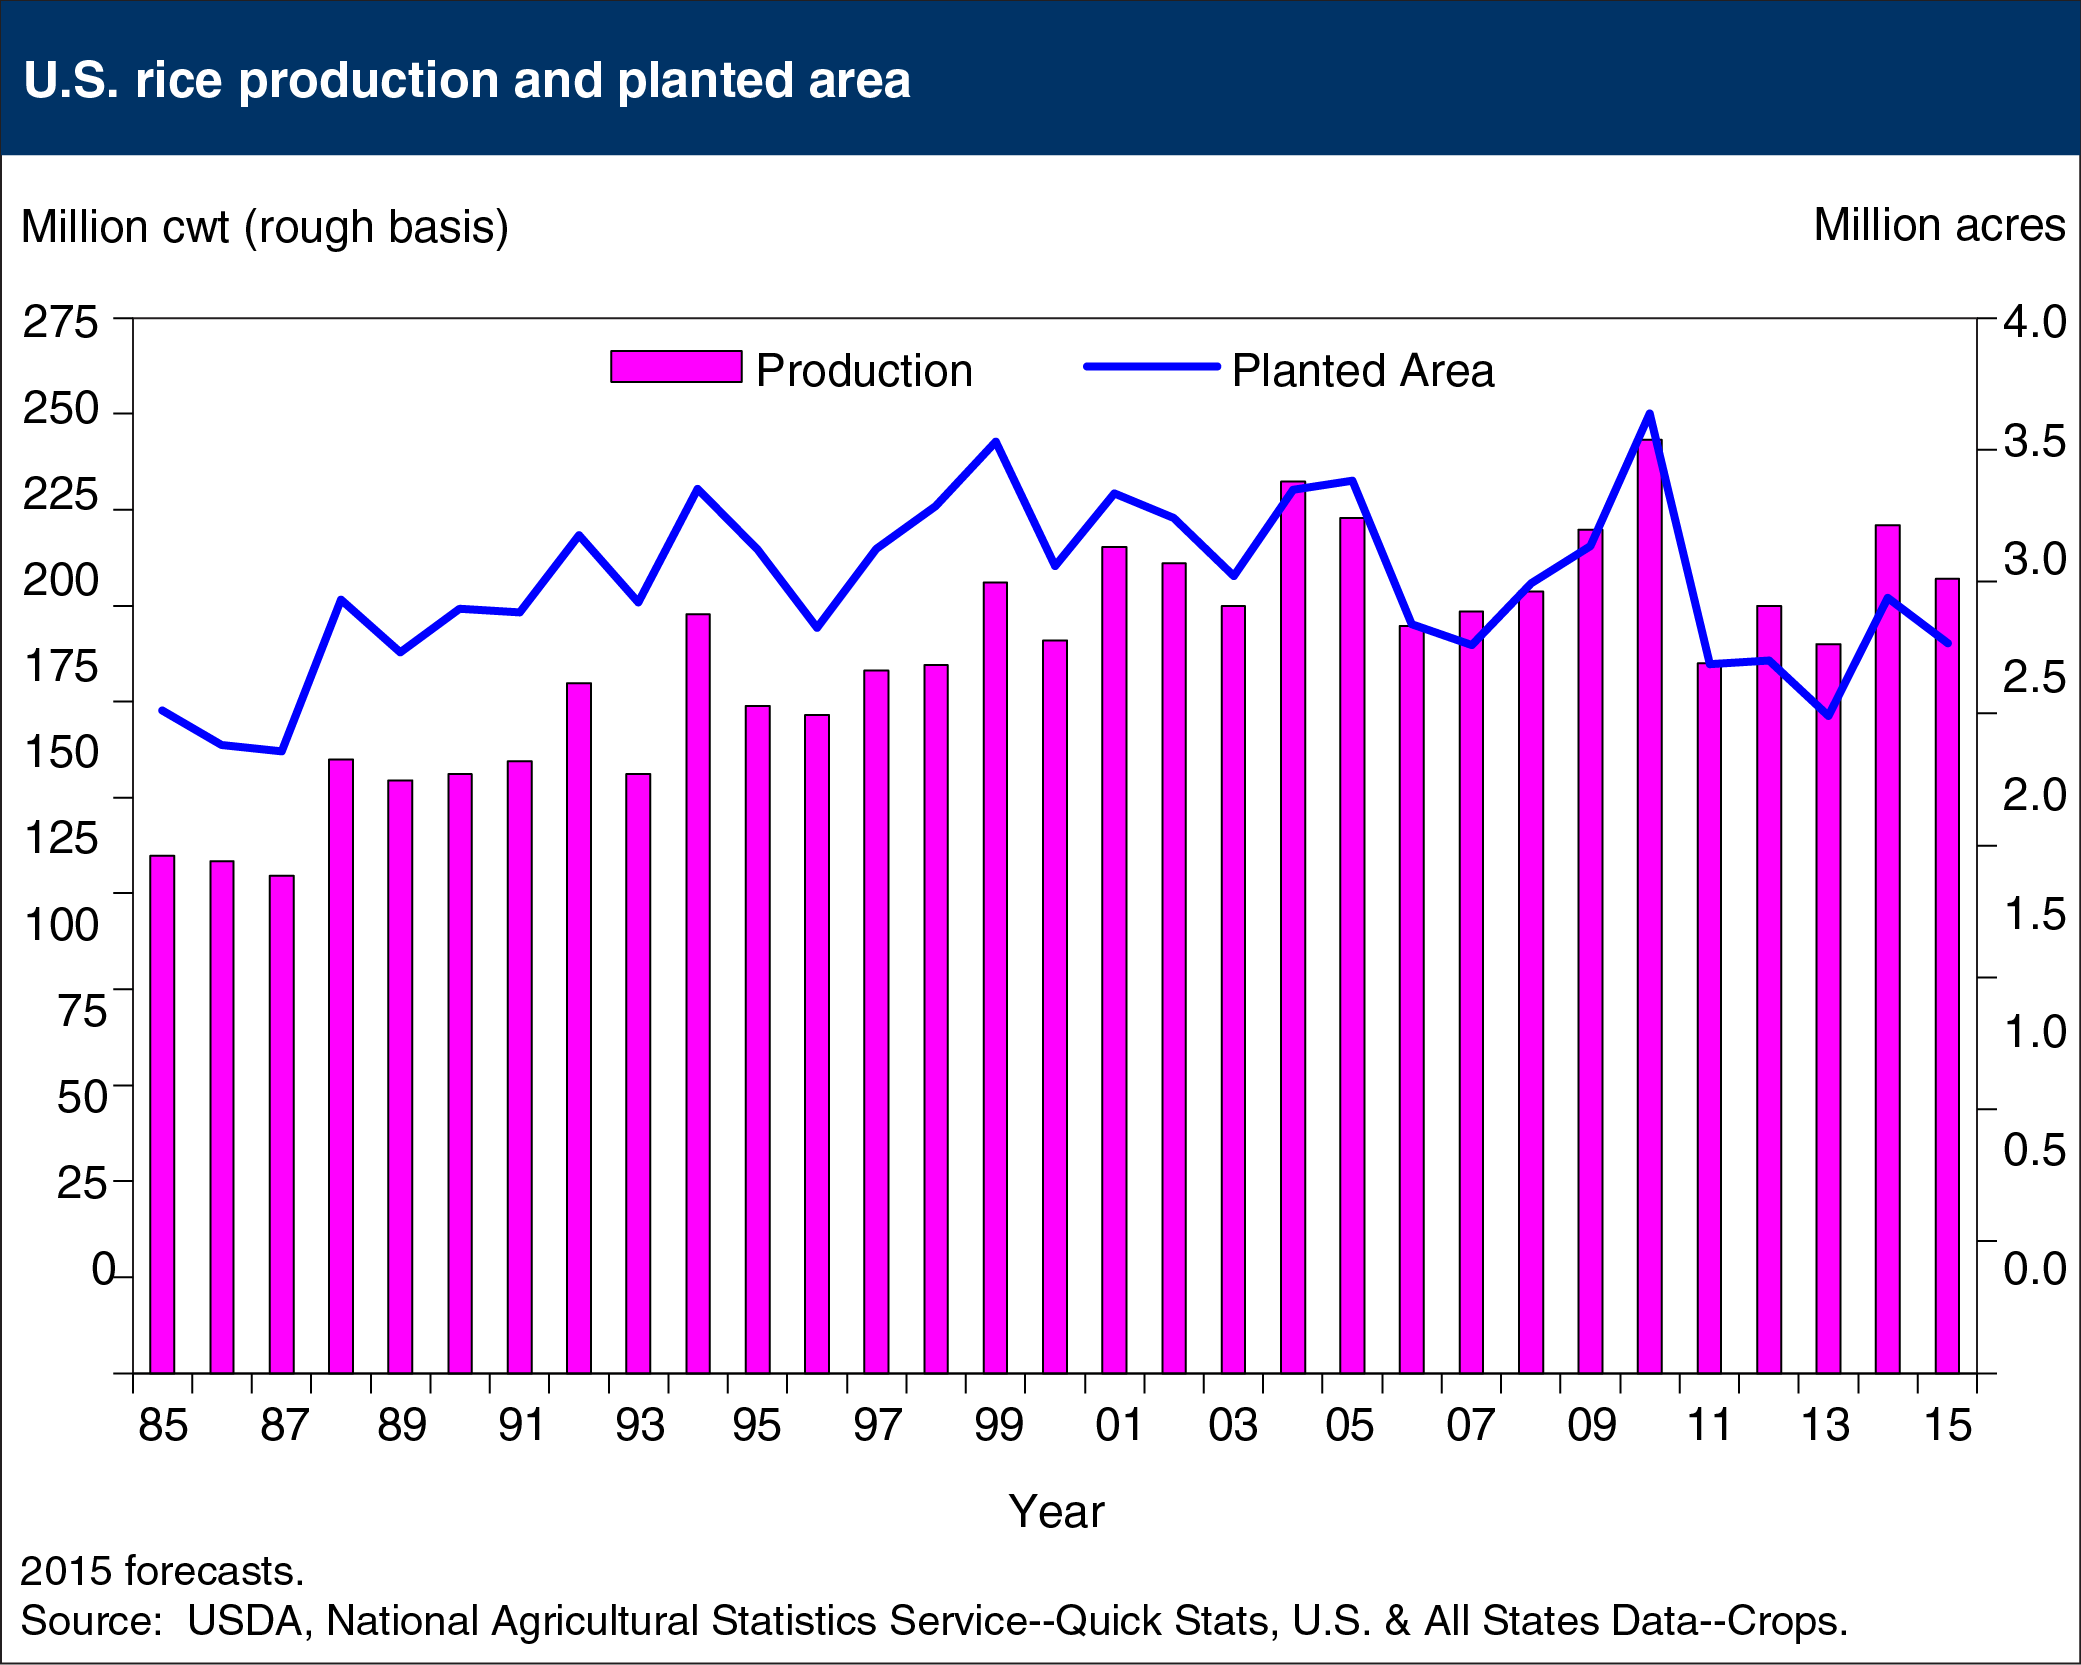
Rice acreage for 2015 is estimated at 2.77 million acres, down 6 percent from last year and 5 percent from March planting intentions. Rice acreage is down in all major producing States, reflecting low prices—especially for long-grain varieties—as well as drought in California, a cool and wet spring across much of the South, and continued water restrictions in Texas. California is reporting the largest percentage decline (11 percent) in rice area, which is the lowest since 1991/92. The 2015 decline follows a 23-percent reduction in rice acreage last year. The large, multi-year declines in California rice area reflect 4 consecutive years of severe drought. Growers in Texas have also faced tightening water restrictions for the past 4 years, and 2015 acreage is down around 20 percent from pre-drought levels, leaving it with the smallest acreage of any rice-producing State. Arkansas—the largest rice-producing State—accounts for more than half of the decline in U.S. rice area this year, with a drop in acreage of more than 6 percent. Arkansas produces both long-grain and medium-grain rice; low prices and unfavorable weather are behind a 9-percent decline in long-grain plantings, while medium-grain plantings in Arkansas increased 25,000 acres (12 percent) this year due to the expectation of favorable prices caused by California’s medium-grain shortfall. Louisiana and Mississippi are also reporting declines in rice acreage this year. This chart is from the July 2015 Rice Outlook report.