
Fresh fruit accounted for 52 percent of U.S. fruit availability in 2010-12
- by Jeanine Bentley and Agnes Perez
- 5/28/2015
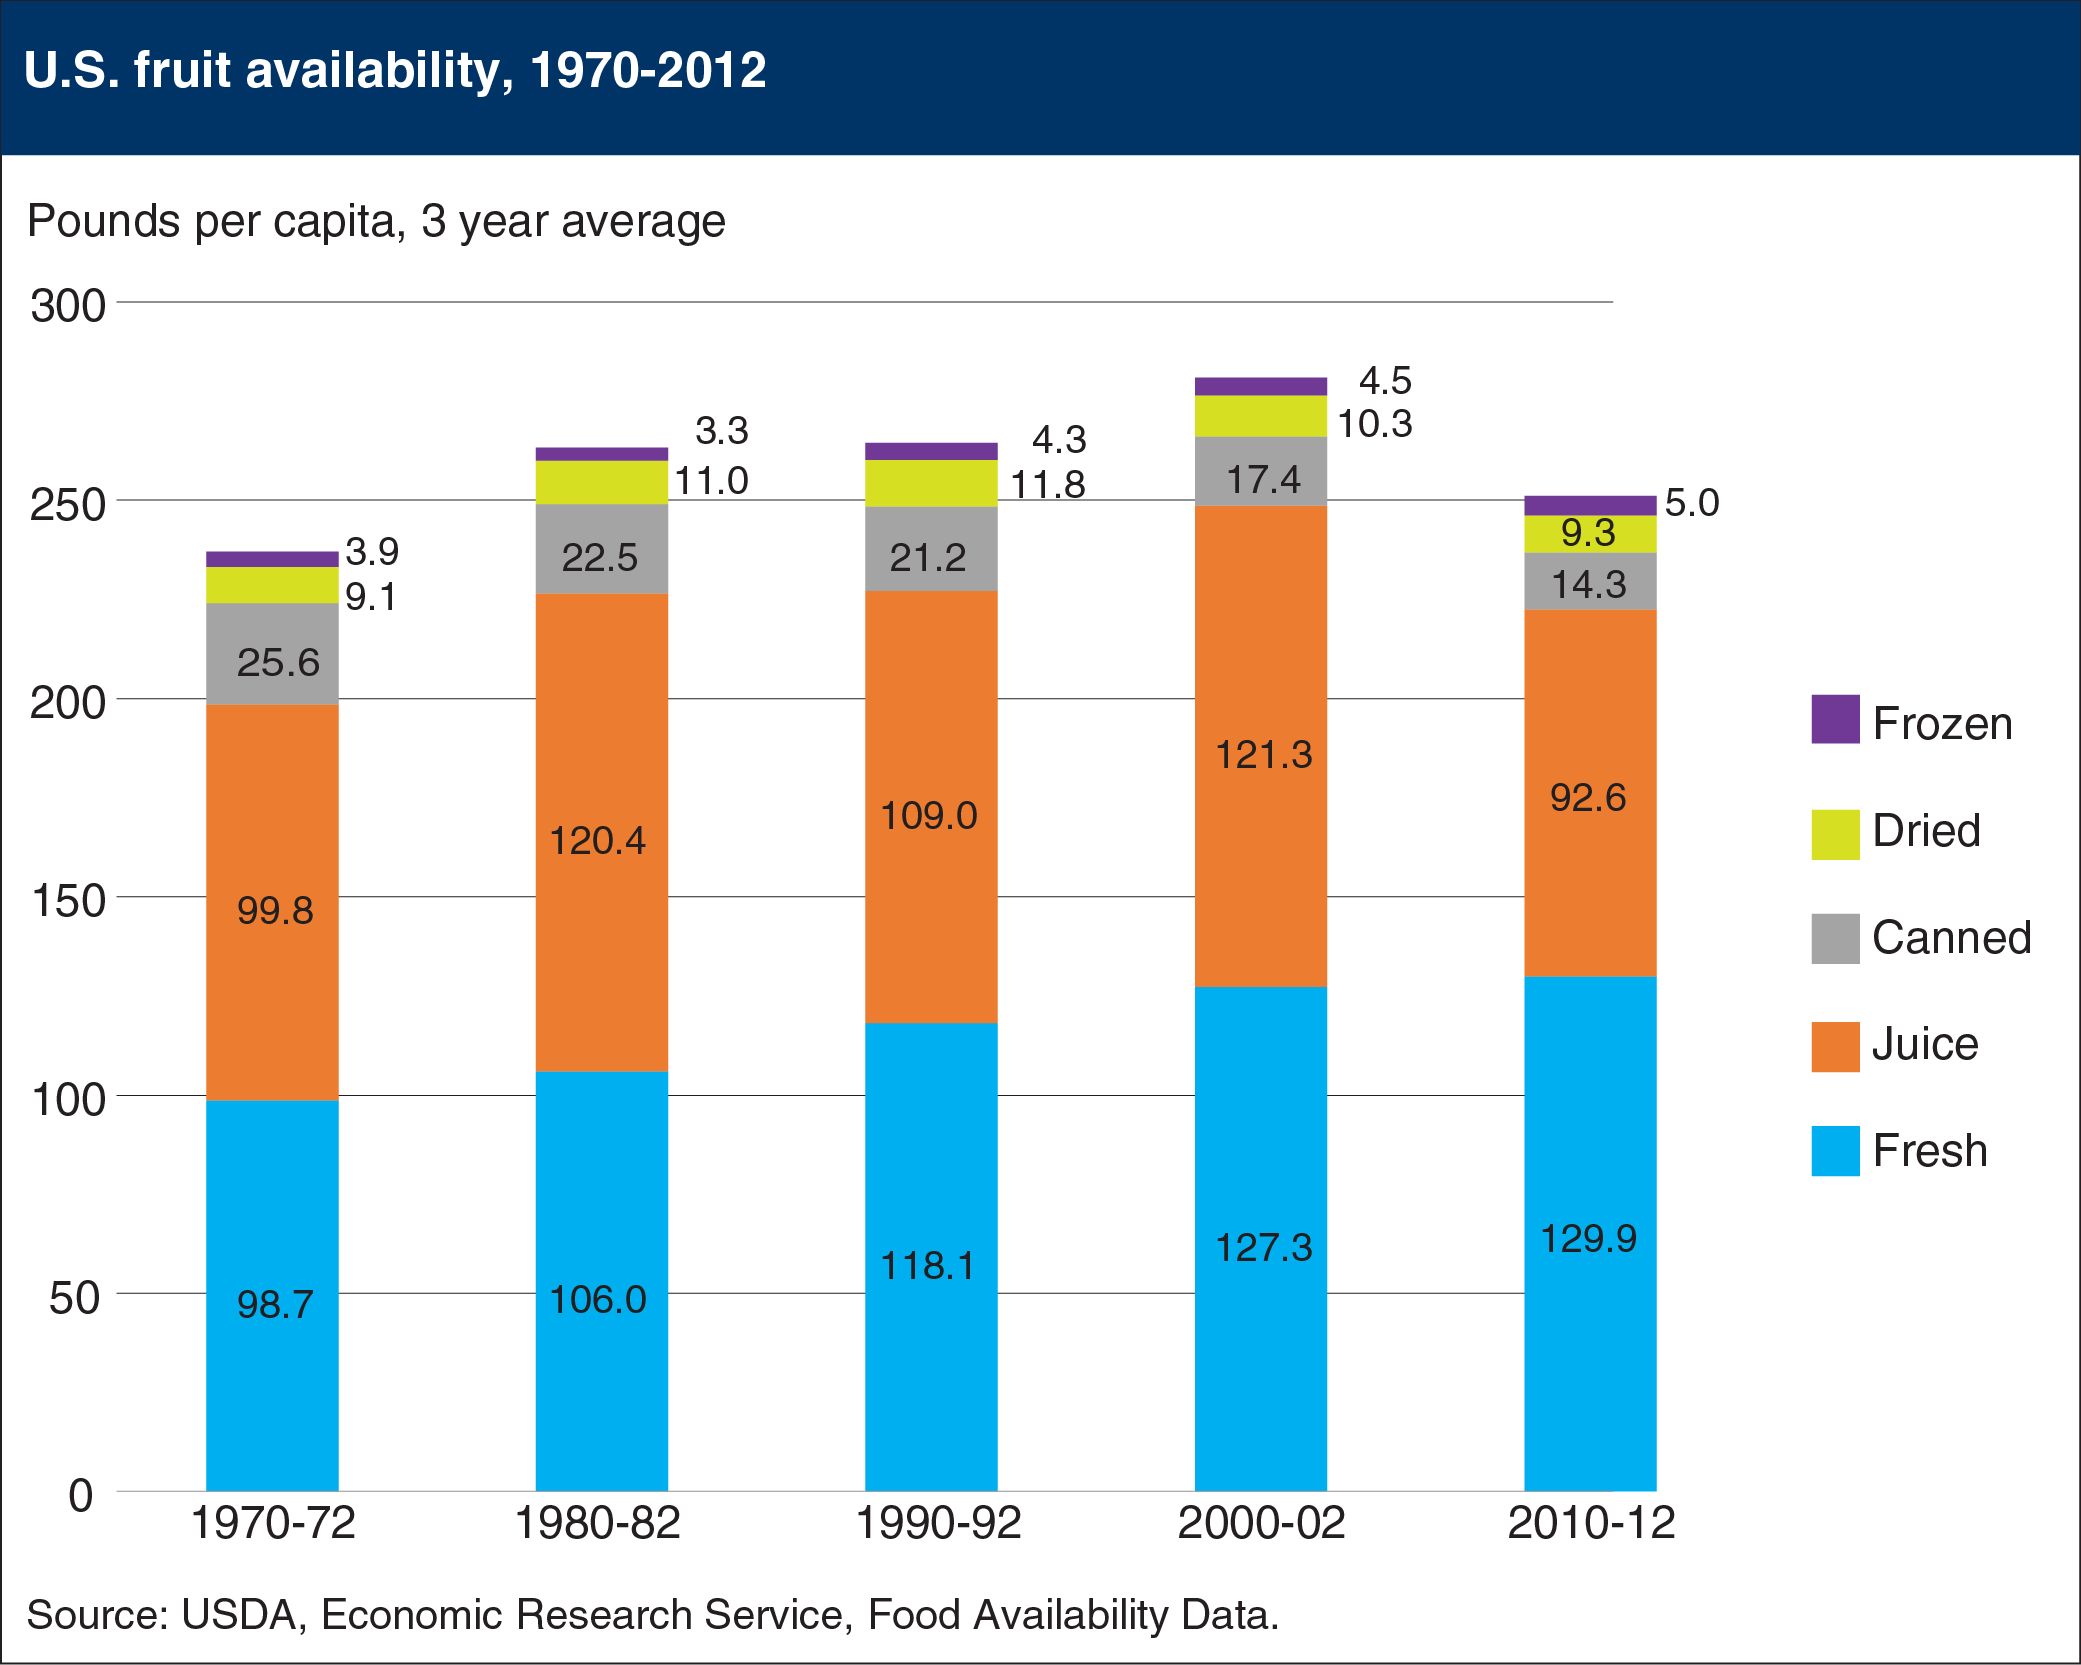
According to ERS’s Food Availability data, per capita supplies of fruit available for consumption in the United States have fallen over the last decade after rising since the early 1970s. In 2010-12, per capita fruit availability was 251 pounds per person (fresh-weight equivalent), down from 281 pounds per person in 2000-02. Increased U.S. production and greater imports of some types of fruit have not compensated for decreased U.S. citrus production. Fresh fruit accounted for 52 percent of fruit availability in 2010-12, up from a 42-percent share in 1970-72. Bananas, apples, and oranges were the most popular fresh fruits in 2010-12, accounting for 40 percent of fresh fruit availability. Processed fruit availability (canned, juice, frozen, and dried forms) has steadily fallen since reaching a peak of 171 pounds per person (fresh-weight equivalent) in 1977 to a low of 114 pounds in 2012. The bulk of the decline came from juice, especially orange juice. Availability of orange juice fell from 97 pounds per person in 1977 to 44 pounds in 2012. This chart appears in “Fresh Fruit Makes Up a Growing Share of U.S. Fruit Availability” in the May 2015 issue of ERS’s Amber Waves magazine.