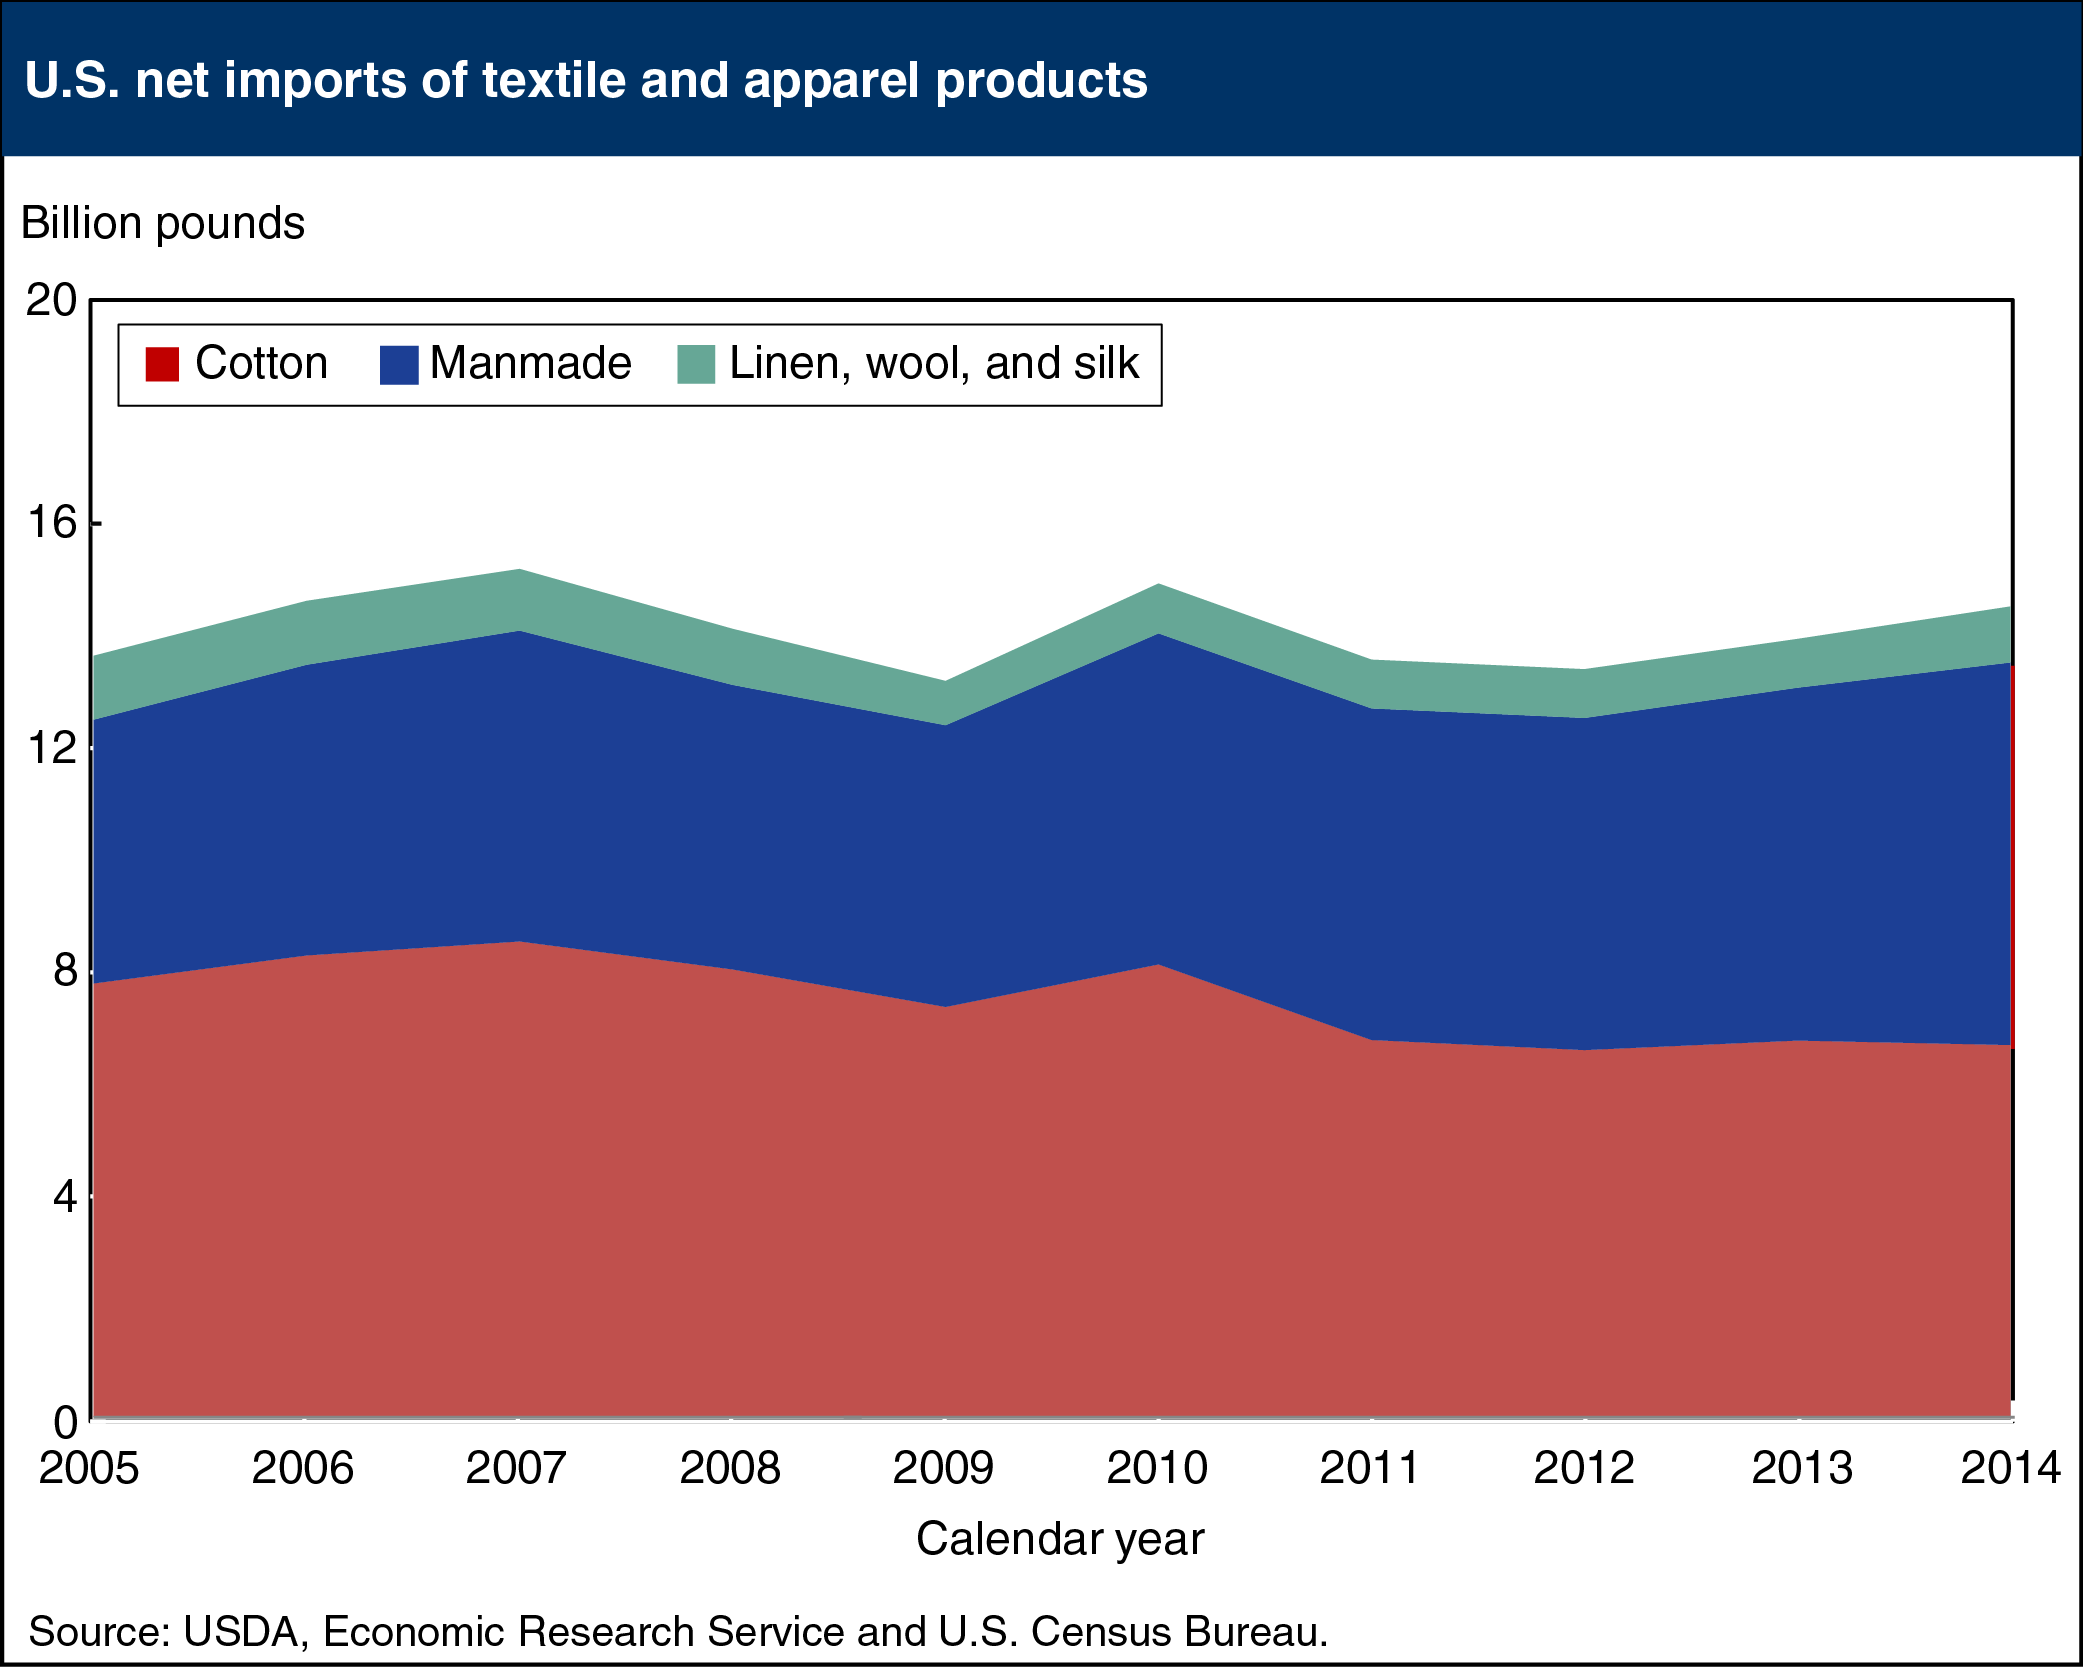
Manmade fibers behind increase in textile and apparel product imports
- by Leslie Meyer
- 4/3/2015

U.S. net textile and apparel fiber imports rose for a second consecutive calendar year in 2014 to their highest level in 4 years. Net imports reached approximately 14.5 billion raw-fiber-equivalent pounds in 2014, compared with 13.9 billion pounds in 2013 and a record 15.1 billion pounds in 2007. In 2014, total fiber product imports grew 3 percent to their highest since 2010, while exports rose 1 percent to their highest level since 2008. U.S. net imports consist largely of cotton and manmade fiber products, but cotton’s share has declined in recent years due to the steady growth in the use of manmade fibers, due in part to their relative price advantage. In 2014, cotton textile and apparel products accounted for about 46 percent of the total, while manmade fibers contributed 47 percent. By comparison, just 5 years ago, cotton contributed nearly 56 percent of the total compared with manmade fibers’ share of 38 percent. This chart is from the March 2015 Cotton and Wool Outlook report.

