
Milk production continues shifting to large scale farms
- by James M. MacDonald
- 12/10/2014
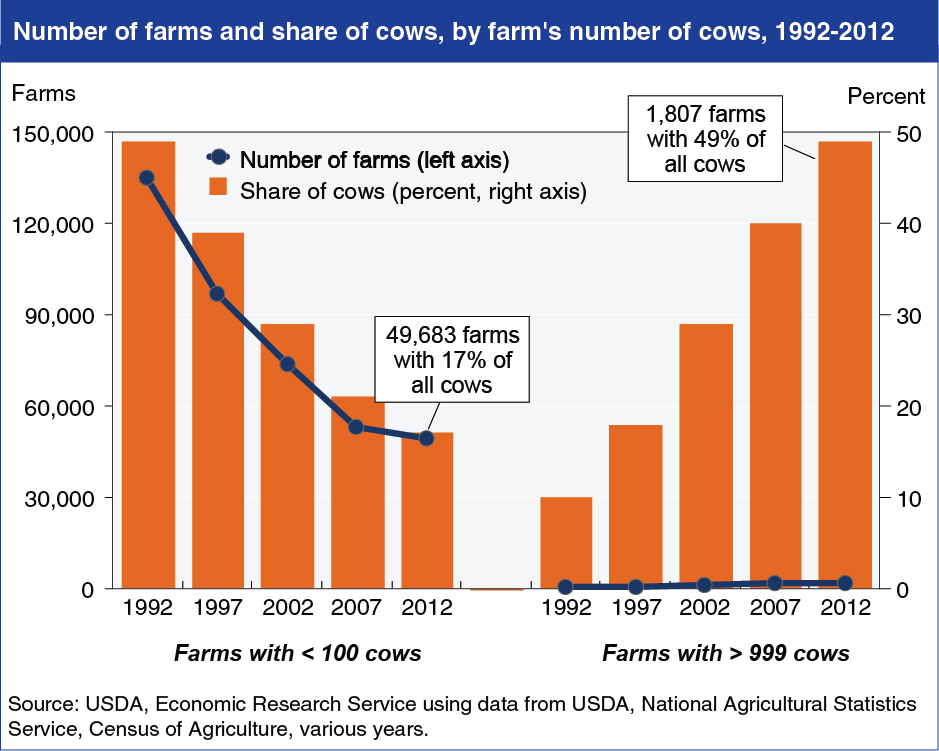
In 2012, there were still nearly 50,000 U.S. dairy farms with fewer than 100 cows, but that represented a large decline from 20 years earlier, when there were almost 135,000 small dairy farms. Over the same period, the number of dairy farms with at least 1,000 cows more than tripled to 1,807 farms in 2012. Movements in farm numbers were mirrored by movements in the share of cow inventories. Farms with fewer than 100 cows accounted for 49 percent of the country’s 9.7 million milk cows in 1992, but just 17 percent of the 9.2 million milk cows in 2012. Meanwhile, farms with at least 1,000 cows accounted for 49 percent of all cows in 2012, up from 10 percent in 1992. The shift to larger dairy farms is driven largely by the economics of dairy farming. Average full costs of production (which include the annualized cost of capital, imputed cost of unpaid family labor, and cash operating expenses) are substantially lower on farms with larger herds. This chart is drawn from the December 2014 Amber Waves data feature, "Milk Production Continues Shifting to Large Scale Farms."