
Fast-food purchasers report more demands on their time
- by Karen Hamrick and Abigail Okrent
- 12/1/2014
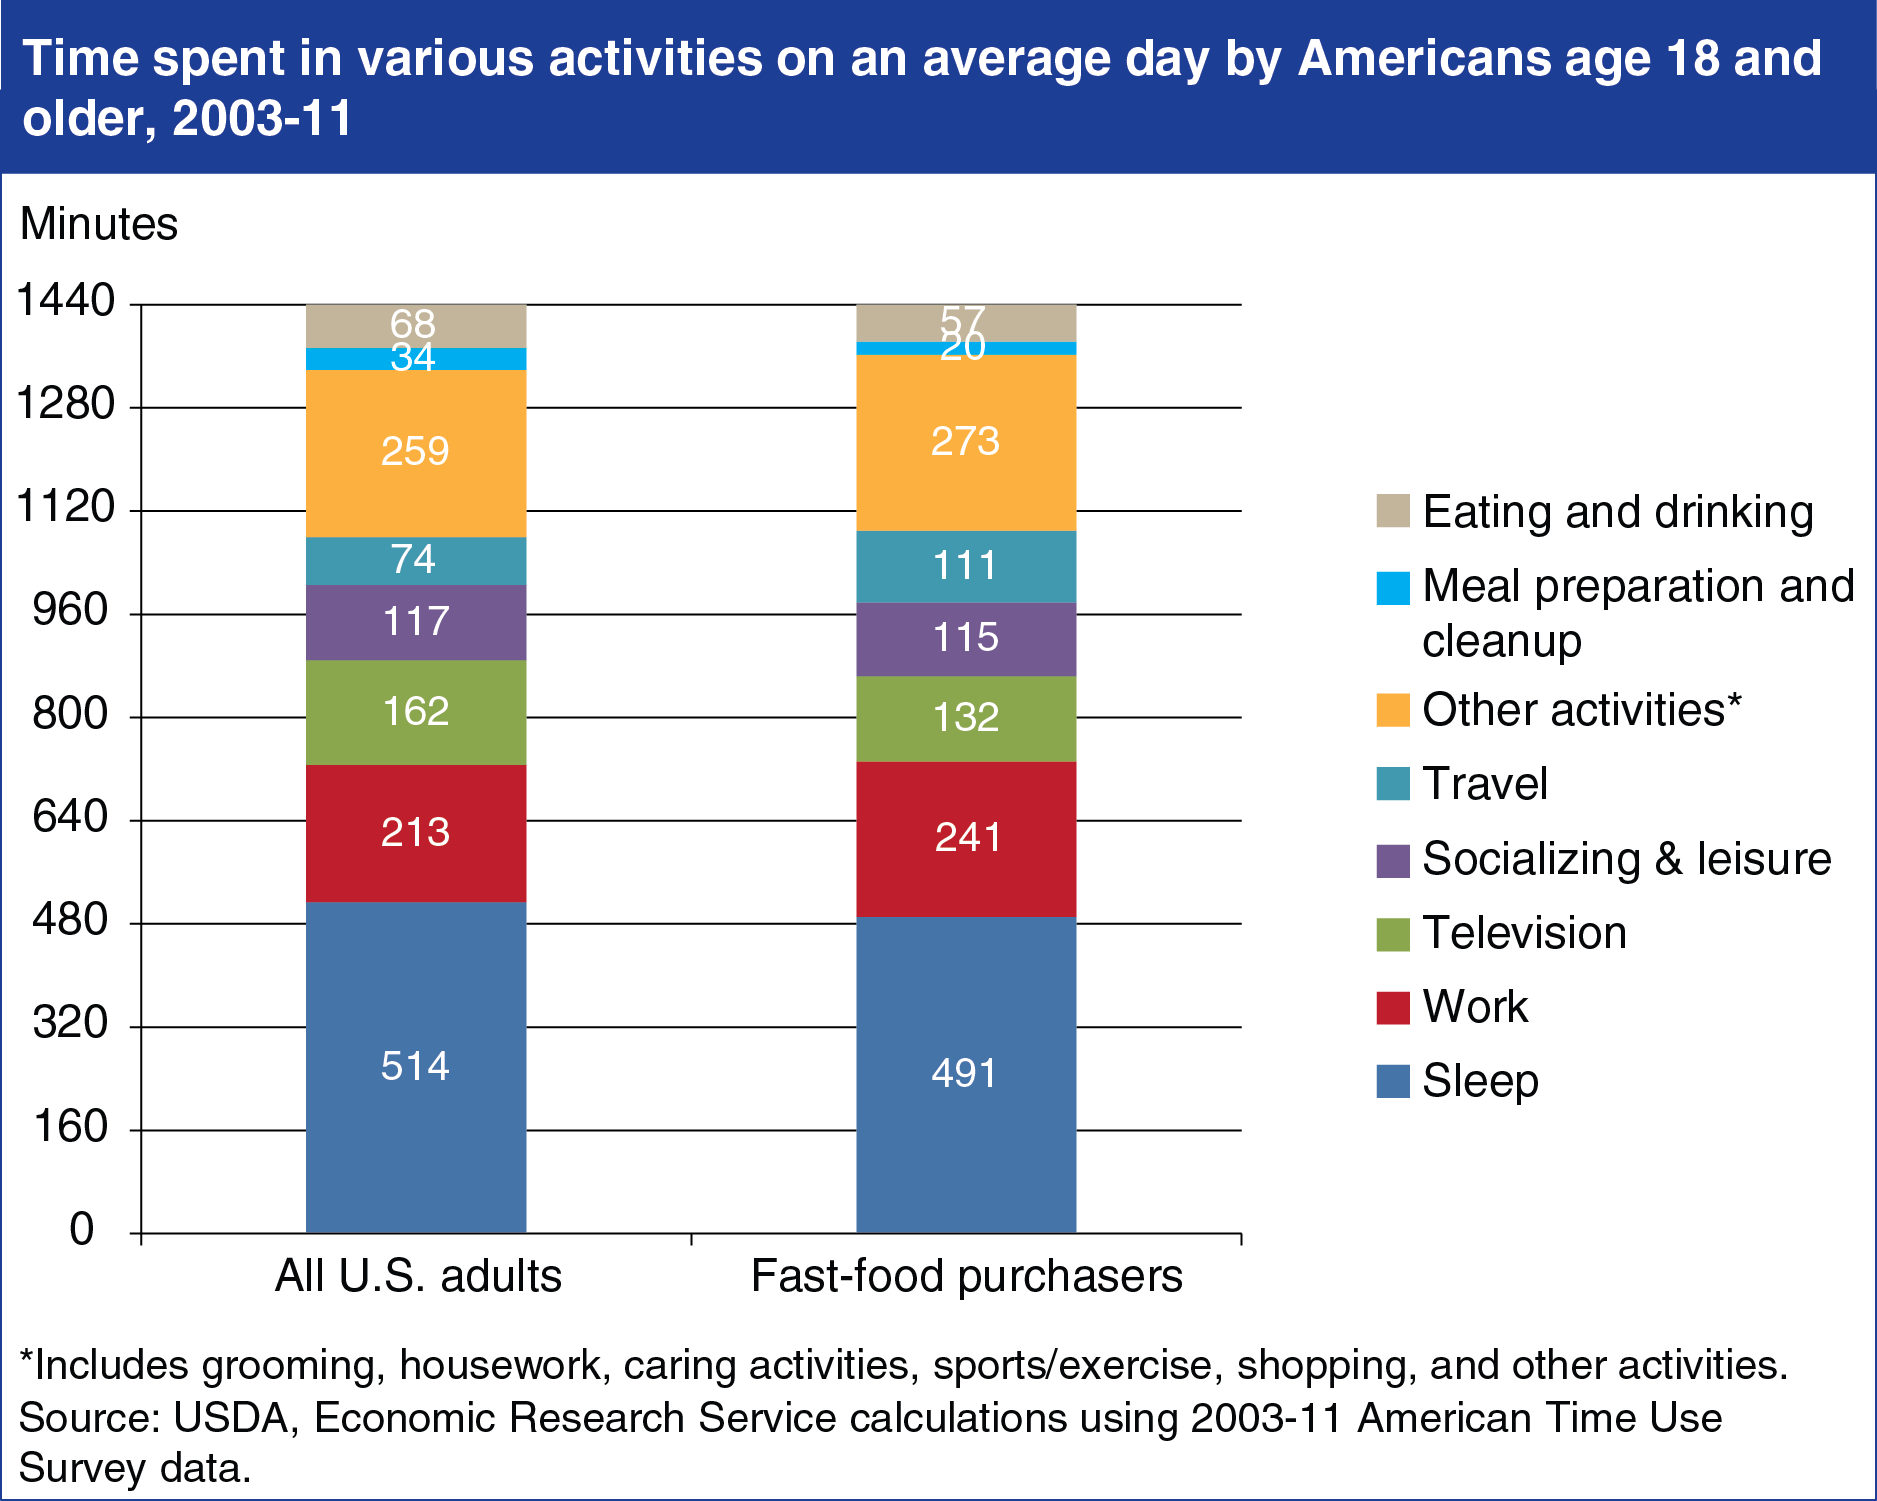
ERS analyses of data from the U.S. Bureau of Labor Statistics’ American Time Use Survey find that Americans age 18 and older who purchased fast food on a given day spent more time working and traveling and less time watching television and sleeping than the average for all adults. Over 2003-11, fast-food purchasers spent 28 more minutes per day working and 23 fewer minutes sleeping than the total adult average. Other research has found that less sleep is associated with poorer food choices. Those who purchased fast food on an average day spent 57 minutes eating and drinking compared with the 68-minute average for all consumers. Fast-food purchasers were also more likely than others to report that they spent no time eating or drinking as the primary (main) activity, as opposed to eating as a secondary activity done while doing something else. Instead, fast-food purchasers were more likely to engage in “secondary eating” while at work or while driving a vehicle. The statistics for this chart are from the ERS report, The Role of Time in Fast-Food Purchasing Behavior in the United States, released on November 20, 2014.