
Creative class county job growth resilient following recession
- by Tim Wojan
- 10/29/2014
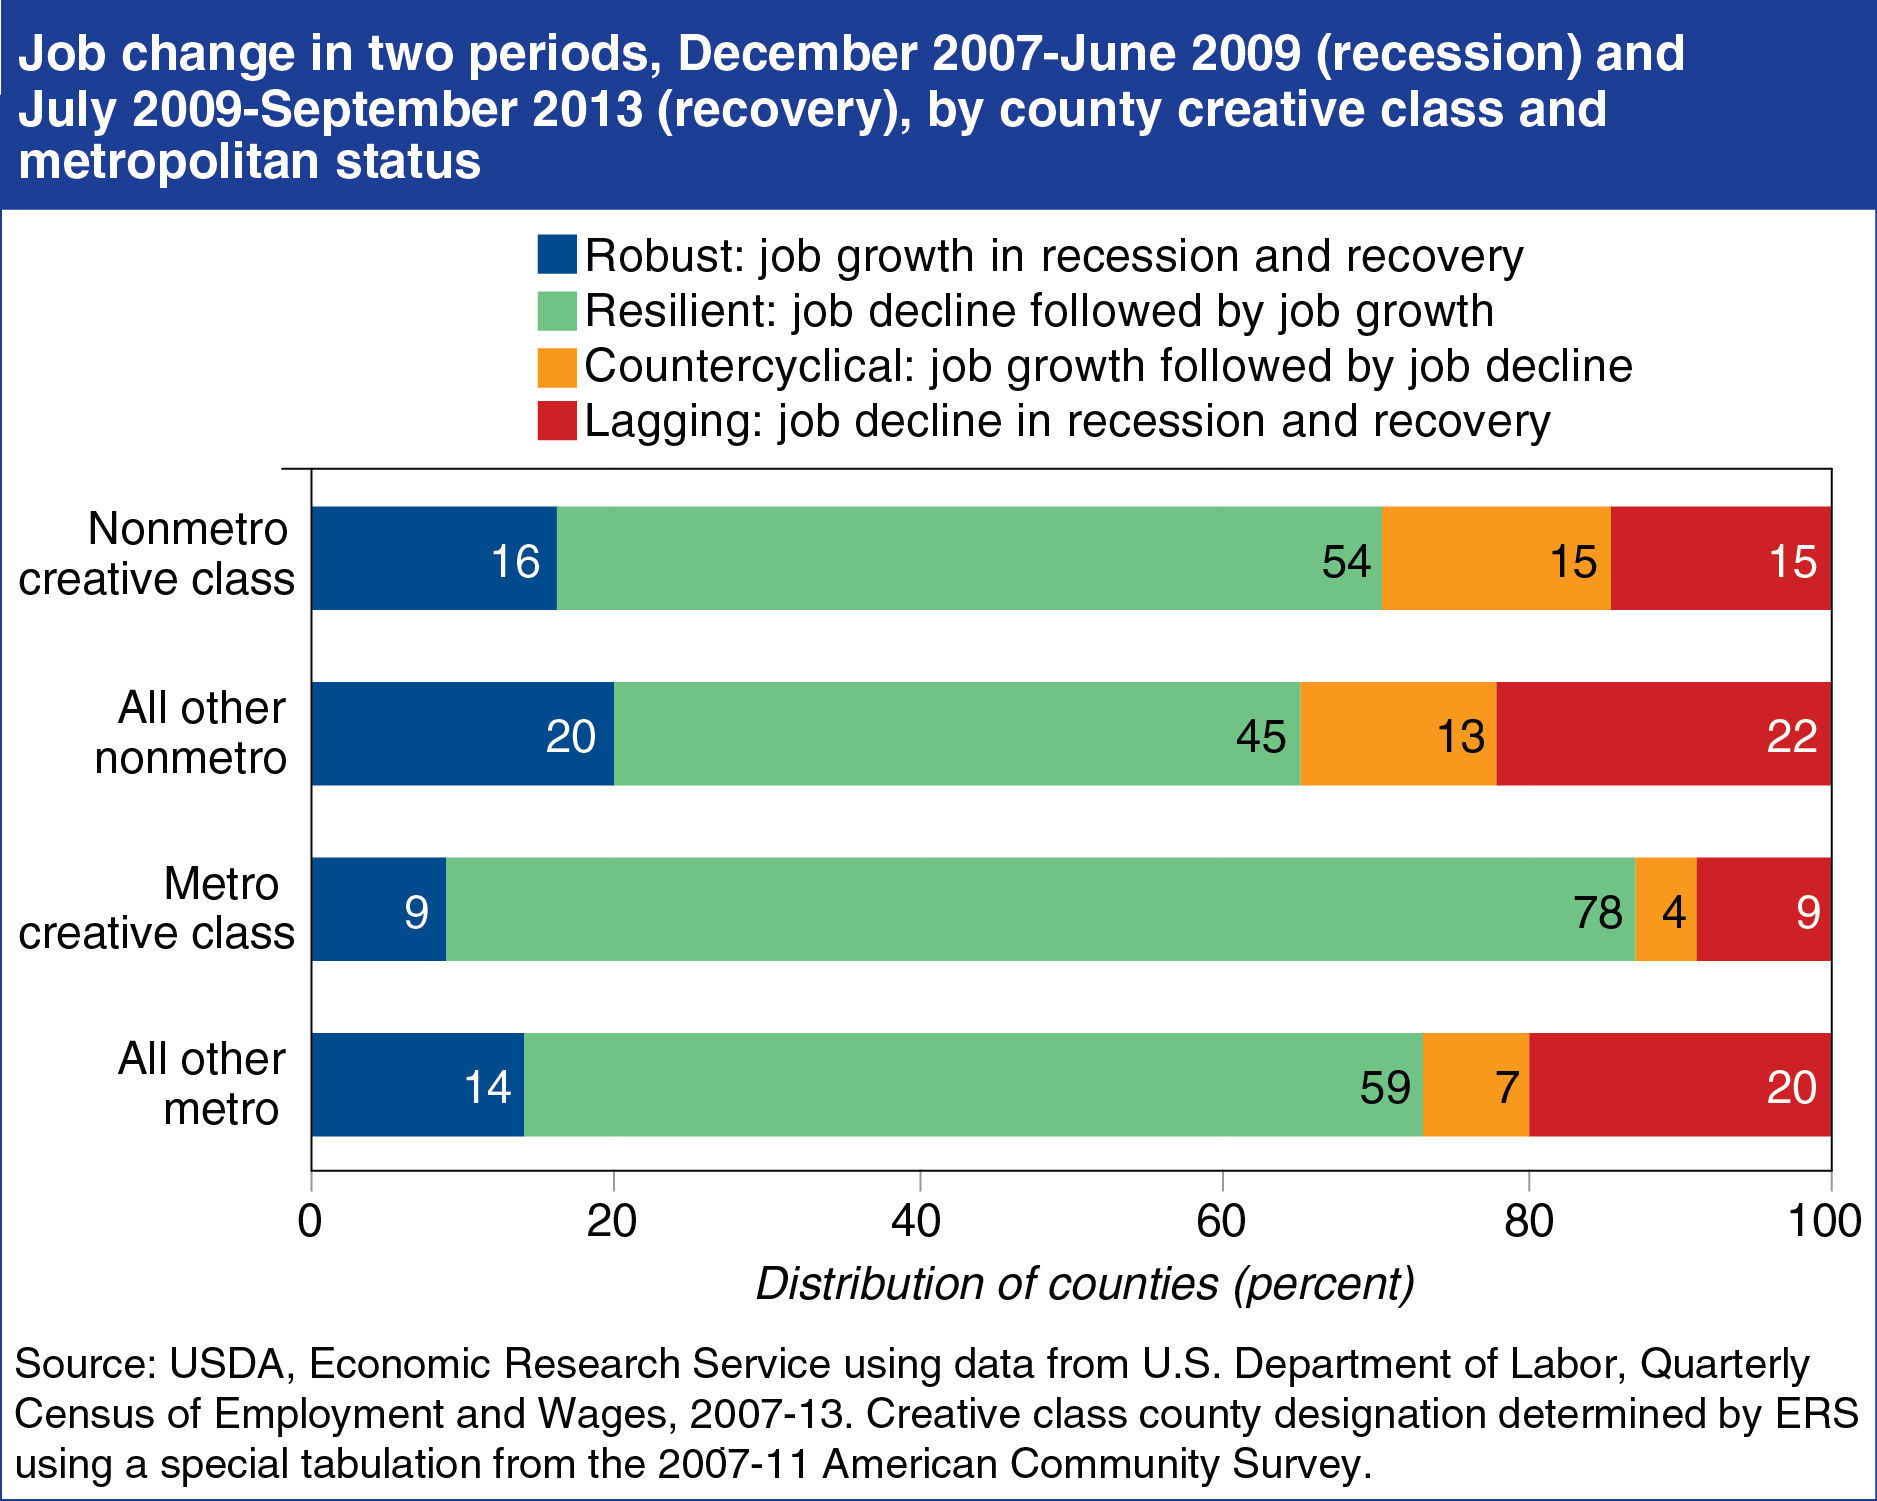
During the pre-recession economic growth years, counties with a high percentage of their workforce employed in “creative” occupations—engineers, scientists, artists, and others tasked with combining knowledge and ideas in novel ways—tended to experience higher rates of local employment growth than other counties, but having a high share of creative jobs did not offer much local job market protection during the 2007-09 recession. “Creative class” counties—those in the top quartile of all counties ranked by their share of creative jobs—were more likely to experience employment losses in the recession than other counties. However, a higher share of creative class counties gained employment during the economic recovery. While a much higher percentage of metro counties have seen recent employment growth whether or not they are creative class counties, a higher share of nonmetro counties gained employment during both the recession and recovery, the latter group benefitting from employment gains driven mainly by the energy boom. This chart is derived from the October 2014 Amber Waves data feature, "What Happened to the "'Creative Class' Job Growth Engine" During the Recession and Recovery?"