
County unemployment rates reflect patterns established during the recession
- by Thomas Hertz
- 10/9/2014
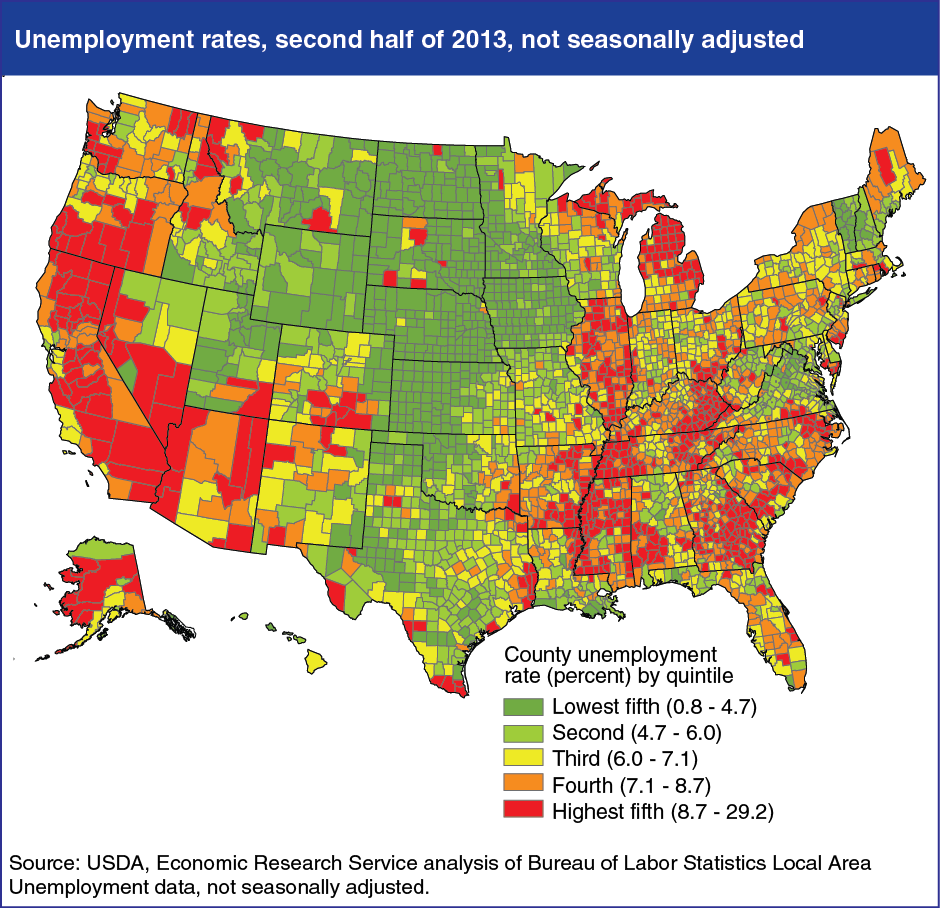
During the 2007-09 recession, unemployment rates rose fastest in the West, South, South Atlantic, and parts of the Midwest. States most reliant on manufacturing—including Michigan, Rhode Island, South Carolina, and North Carolina—were hit especially hard. Many of the States with the smallest increases in unemployment were located in the Great Plains and had relatively high employment shares in agriculture, which was largely unaffected by the recession. Similarly, States in the West South Central region (which includes Oklahoma, Texas, Louisiana, and Arkansas) saw their unemployment rates held in check by growth in oil and gas drilling. Since 2009, unemployment rates have fallen in all States, with large improvements in a few. In general, States that experienced the largest increases in unemployment rates during the recession have seen the largest reductions in unemployment rates during the recovery. Still, most of the hardest-hit States continue to have above-average unemployment rates. As a result, the current geography of county unemployment rates still reflects the patterns established during the recession. Many of the counties with the lowest unemployment rates (below 4.7 percent) are located in or near the Great Plains. The highest unemployment rate counties (above 8.7 percent) are concentrated in the West, South, and South Atlantic, as well as in Appalachia and parts of the Rust Belt. This chart is found in the October 2014 edition of Amber Waves.