
Top U.S. agricultural export markets located in Asia and North America
- by Maurice Landes
- 10/3/2014
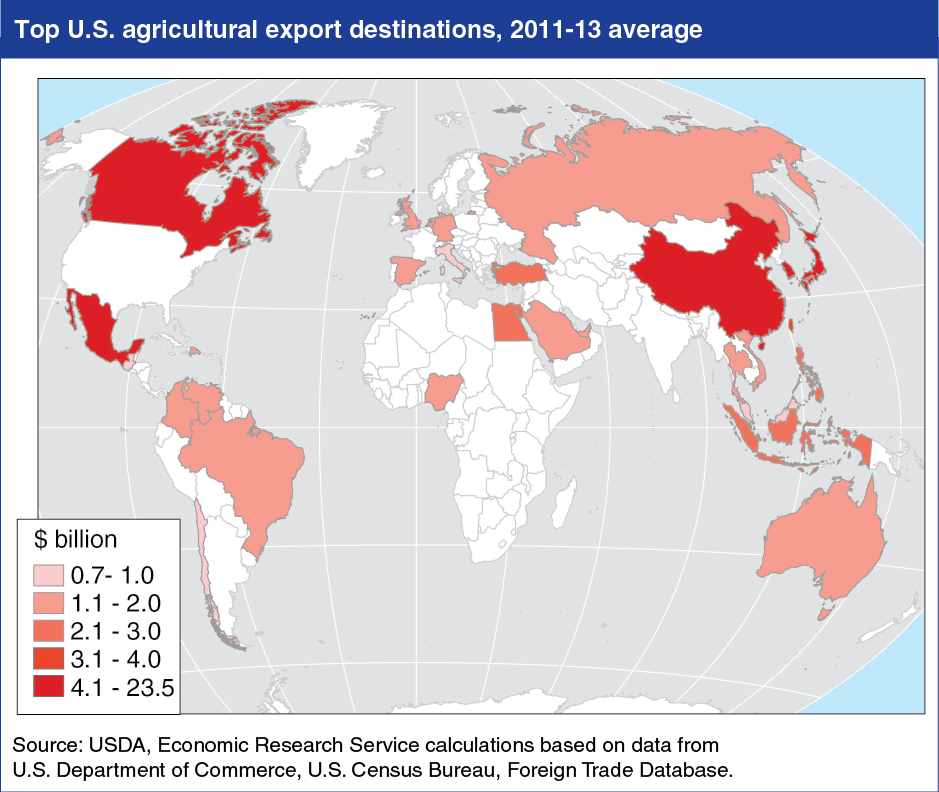
Most of the largest individual country markets for U.S. agricultural exports are in Asia and North America. China, with its strong demand for soybeans, cotton, cattle hides, tree nuts, and other horticulture products, has become the largest single U.S agricultural market, with annual U.S. exports averaging $23.5 billion during 2011-13. Canada (with 2011-13 average U.S. exports of $20.3 billion) and Mexico ($18.5 billion) are the second and third largest markets, with trade in a broad range of agricultural commodities aided by reforms introduced by the 20-year-old North American Free Trade Agreement (NAFTA). Japan ($13.2 billion) is the fourth largest U.S. market, and the next five top ranked markets are also in Asia: South Korea ($6.0 billion), Hong Kong ($3.5 billion), Taiwan ($3.3 billion), Indonesia ($2.7 billion), and the Philippines ($2.3 billion). Total U.S. agricultural exports were a record $144.1 billion in 2013, and averaged $140.6 billion during 2011-13. Find this chart and more in Selected Charts 2014, Ag and Food Statistics: Charting the Essentials.