
The 2012 Census of Agriculture finds slightly fewer U.S. farms
- by Robert A. Hoppe
- 4/9/2014
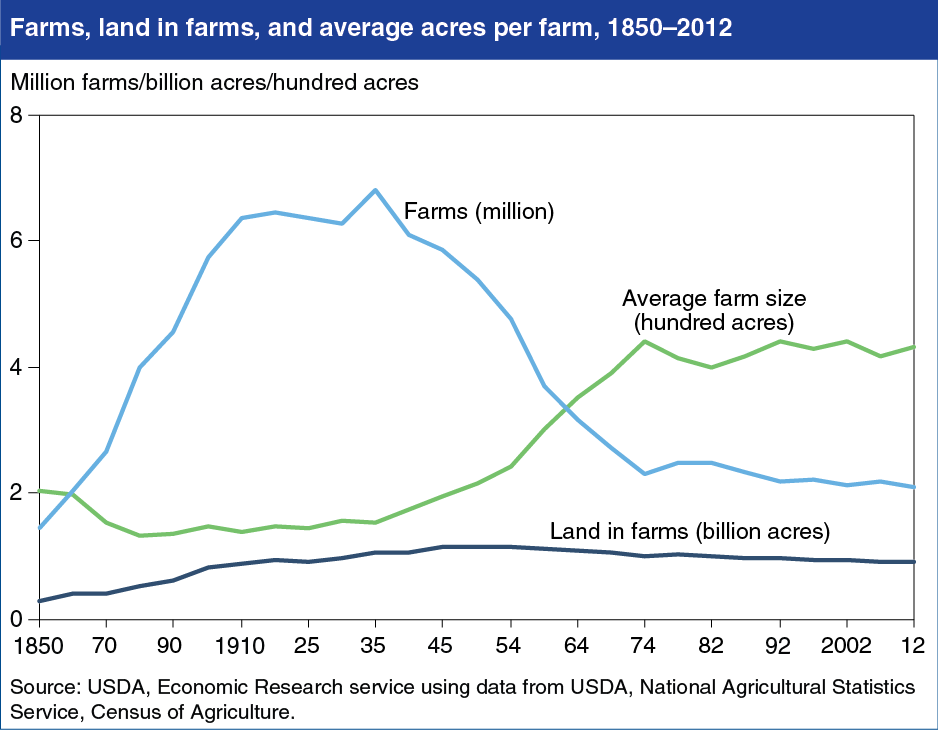
After peaking at 6.8 million farms in 1935, the number of U.S. farms fell sharply until leveling off in the early 1970s. Falling farm numbers during this period reflected growing productivity in agriculture and increased nonfarm employment opportunities. Because the amount of farmland did not decrease as much as the number of farms, the remaining farms have more acreage—on average, about 430 acres in 2012 versus 155 acres in 1935. Preliminary data from the recently released Census of Agriculture show that in 2012, the United States had 2.1 million farms–down 4.3 percent from the previous Census in 2007. Between 2007 and 2012, the amount of land in farms in the United States continued a slow downward trend, declining from 922 million acres to 915 million. This chart is found in the ERS chart collection, Ag and Food Statistics: Charting the Essentials, updated April 8, 2014.