
Rural counties drive the 2000-11 growth in U.S. onshore production of oil and natural gas
- by Economic Research Service
- 2/21/2014
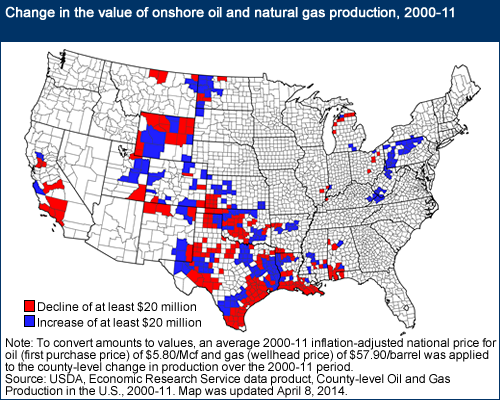
From 2000 to 2011, onshore gross withdrawals of natural gas in the lower 48 States increased by about 47 percent, reaching historic highs in every year after 2006. Over the same period, withdrawals of oil increased by 11 percent, with much of that growth occurring between 2007 and 2011. Rural counties (nonmetro noncore) accounted for almost all of the growth in oil production and a large share of the growth in gas production based on newly released data from ERS on County-level Oil and Gas Production in the U.S. While just over 35 percent of counties in the lower 48 States reported some level of oil or natural gas production during 2000-11, sizeable changes in production levels were more concentrated. Interestingly, the number of counties with an increase in oil and gas production of $20 million or more over the decade (218 counties) was nearly the same as the number (212) with a decrease of $20 million or more. This map is found in the Documentation and Maps page of the data product County-level Oil and Gas Production in the U.S., and also in the Amber Waves article, "Onshore Oil and Gas Development in the Lower 48 States: Introducing a County-Level Database of Production for 2000-2011."