
Crop acreage has shifted to larger farms
- by James M. MacDonald
- 1/16/2014
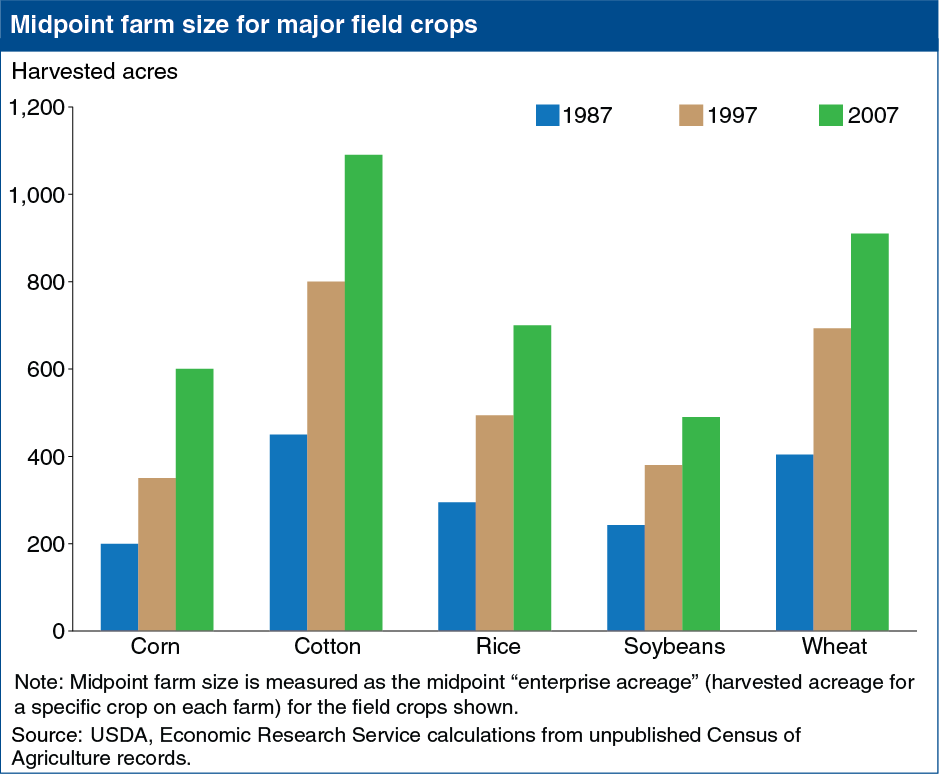
Researchers can track the shift of cropland into larger farms using a measure that splits the distribution of U.S. acreage so that half of all cropland is on farms larger than the midpoint and half is on smaller farms. Rather than reflecting an average farm, the midpoint captures the size of farm that holds the average acre. The midpoint size for all crop farms was 589 acres in 1982, and cropland has steadily shifted to larger farms since then, nearly doubling by 2011 to 1,100 acres. The shift is widespread across specific crops. Midpoints increased for most fruit and vegetable crops, with an average increase of 100 percent between 1987 and 2007 (the last year for which census data are currently available). Midpoints also more than doubled for all major field crops over this period. For example, the midpoint enterprise size for corn (the harvested acreage on each farm) rose from 200 acres in 1987 to 600 acres in 2007. This chart is found in “Cropland Consolidation and the Future of Family Farms” in the September 2013 issue of Amber Waves magazine.