
Employment growth in nonmetro micropolitan and noncore counties has lagged growth in metro counties since 2010
- by Economic Research Service
- 10/23/2013
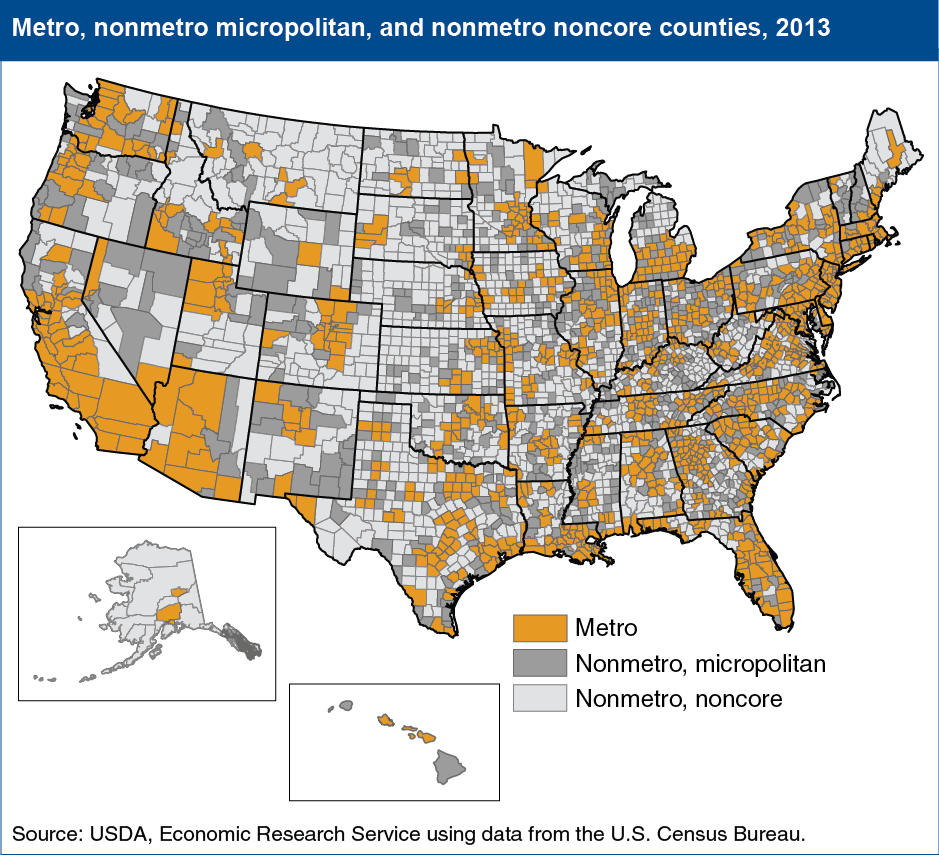
Metropolitan (metro) counties have fared better than both micropolitan and noncore counties (shown in the map) following the 2007-09 recession. ERS researchers generally define “rural” as micropolitan and noncore counties (together referred to as nonmetropolitan or nonmetro counties), and “urban” as metropolitan or metro counties. During the National economic recovery period between 2010 and 2012, employment increased by 2.5 percent in metro counties, compared with 1.1 percent in micropolitan, and 0.5 percent in noncore counties. Metro counties are densely settled counties with an urban core population of 50,000 or more, and outlying counties tied to the central core by labor force commuting. Micropolitan counties are similar to metro counties, but include an urban core with a population between 10,000 to 49,999, and outlying counties tied to the core by commuting. Noncore areas are the remaining counties that are neither metro nor micropolitan. As of February 2013, the Office of Management and Budget identified 1,167 metro counties, 641 micropolitan counties, and 1,335 noncore counties. This map is found in the ERS topic page on Rural Classifications, updated in May 2013.