
Midpoint farm sizes more than doubled in the Corn Belt and Northern Plains between 1982 and 2007
- by Economic Research Service
- 9/10/2013
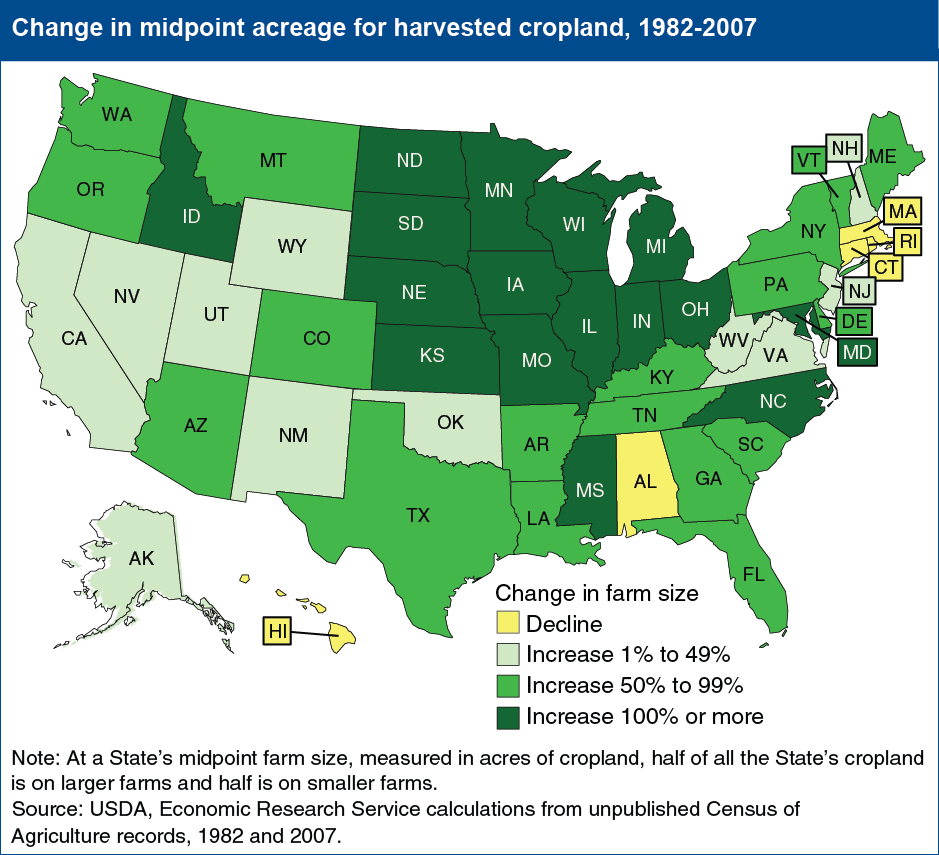
The pace of cropland consolidation between 1982 and 2007 varied widely across States, although most saw substantial increases in the amount of cropland harvested by larger farms. Only five States (Alabama, Hawaii, and three in southern New England) experienced declines in midpoint farm sizes and, therefore, a shift of harvested cropland to smaller farms. In the other 45 States, acreage shifted to larger farms. During the period, the midpoint farm size increased by at least 100 percent in each of the 12 contiguous States in the Corn Belt and Northern Plains, as well as several other States, and by 50-99 percent in another 18 States. This map is found in “Cropland Consolidation and the Future of Family Farms” in the September 2013 issue of Amber Waves magazine.