
14.5 percent of U.S. households struggled to put enough food on the table in 2012
- by Economic Research Service
- 9/5/2013
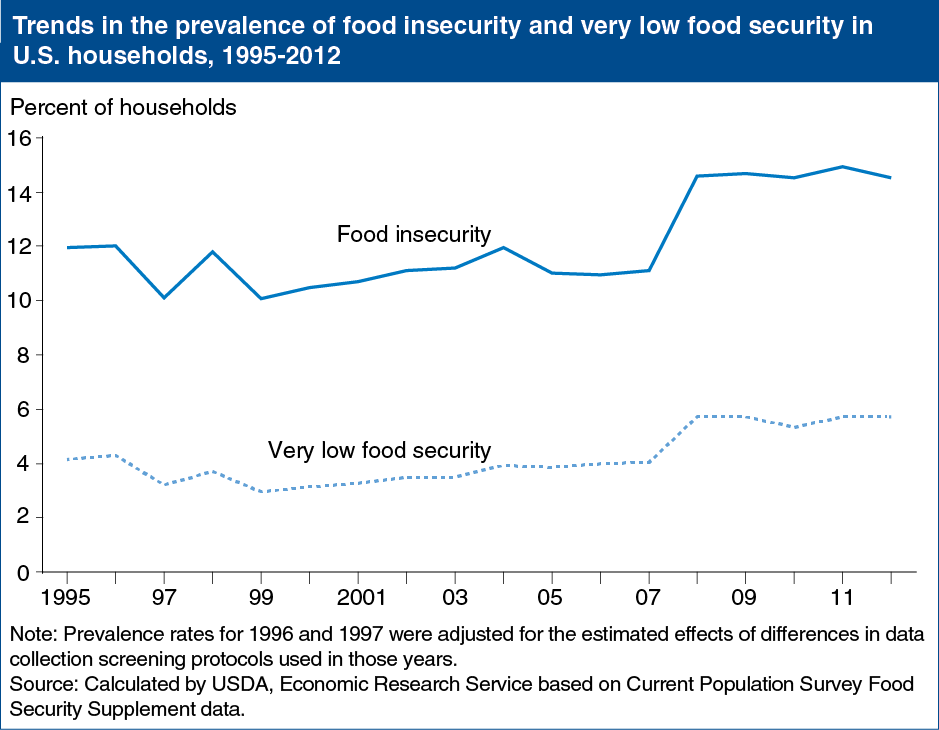
In 2012, 85.5 percent of U.S. households were food secure throughout the year. The remaining 14.5 percent (17.6 million households) were food insecure. Food-insecure households had difficulty at some time during the year providing enough food for all their members due to a lack of resources. After rising from 11.1 percent in 2007, the prevalence of food insecurity has been essentially unchanged since 2008. In 2012, 5.7 percent of U.S. households (7.0 million households) had very low food security. In this more severe range of food insecurity, the food intake of some household members was reduced and normal eating patterns were disrupted at times during the year due to limited resources. This chart appears in Household Food Security in the United States in 2012, ERR-155, released September 4, 2013.