
Measuring crop farm consolidation as the nature of U.S. agriculture changes
- by Economic Research Service
- 8/6/2013
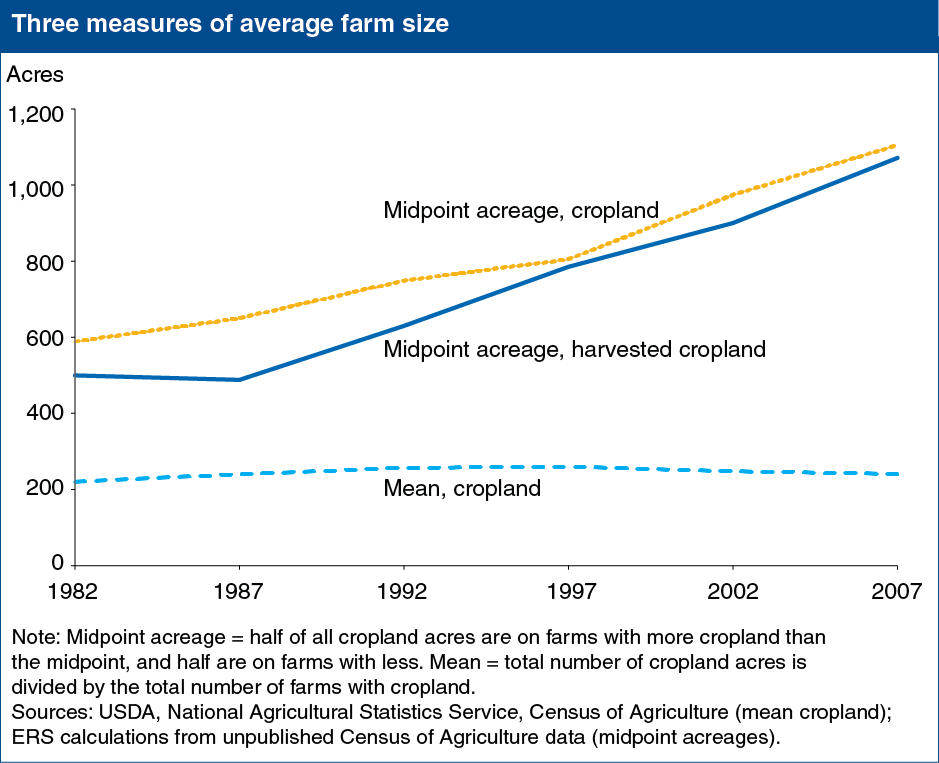
The complexity of U.S. crop farm structure makes the nationwide shift of acreage to larger farms hard to discern with common metrics. In recent years, the number of mid-size crop farms has declined sharply, while farm numbers at the extremes (large and small) have grown. As a result the size of the average farm (in acres) has changed little, but large farms have gotten considerably larger. Simple means and medians focus on the average farm, but relatively few cropland acres are on average-size farms. To get at the use of cropland, the midpoint acreage (at which half of all cropland acres are on farms with more cropland than the midpoint, and half are on farms with less) effectively tracks cropland consolidation over time. While the average (mean) number of acres planted by crop farms has changed little in the last three decades, the midpoint acreage of both planted and harvested cropland has increased dramatically, from roughly 500-600 acres in 1982 to roughly 1,100 acres in 2007. This chart is found in the ERS report, Farm Size and the Organization of U.S. Crop Farming, ERR-152, August 2013.