
Persistent-poverty counties are mostly nonmetro, generally Southern
- by Economic Research Service
- 7/19/2013
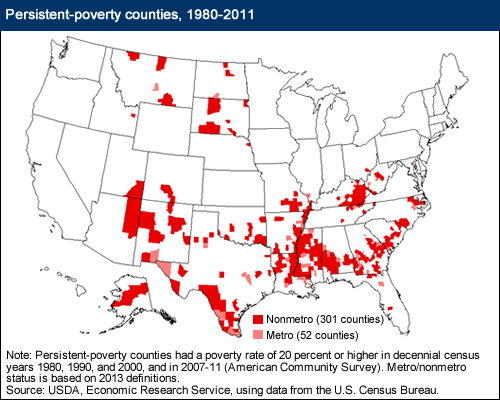
An important dimension of poverty is time. An area that has a high level of poverty this year, but not next year, is likely better off than an area that has a high level of poverty in both years. To shed light on this aspect of poverty, ERS has defined counties as being persistently poor if 20 percent or more of their populations were living in poverty over the last 30 years (measured by the 1980, 1990, and 2000 decennial censuses and the 2007-11 American Community Survey). Using this definition, there were 353 persistently poor counties in the United States. The large majority (301) of the persistent-poverty counties were nonmetropolitan (nonmetro) and exhibited a strong regional pattern. There are no nonmetro persistent-poverty counties in the Northeast, 29 nonmetro persistent-poverty counties in the Midwest, and 20 in the West. The remaining 252 nonmetro persistent-poverty counties are in the South, comprising just over 26 percent of the total Southern nonmetro population. This map is one of the county classifications found in the Atlas of Rural and Small Town America on the ERS website.