
Understanding farm income's role in farm household finances
- by Economic Research Service
- 5/28/2013
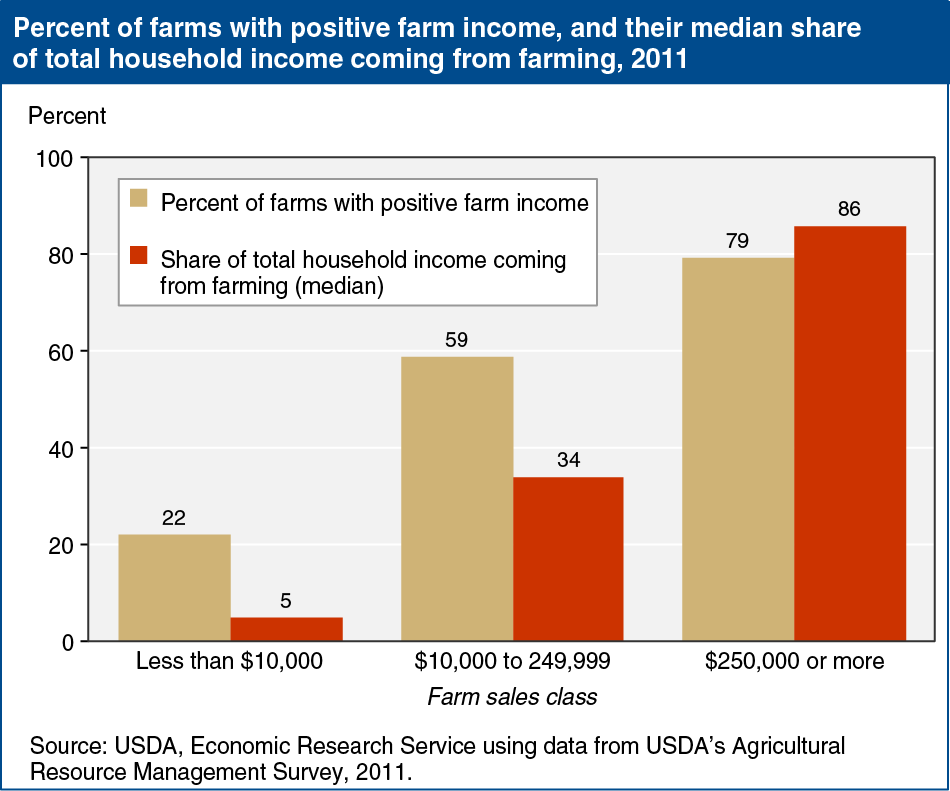
Over the last 20 years, U.S. farm income has represented as little as 4.6 percent of total annual farm household income and never more than 17.5 percent. However, this indicator of farm income’s importance to farm household finances can be misleading since the broad definition of a farm results in a population that includes many households with little or no agricultural production. The role of farm income is better understood by looking at the percent of households with positive income from farming and, for them, the median share of total household income coming from farming. When disaggregated by farm sales class, it becomes clear that farm income contributes little to the annual income of farm households operating smaller farms, is a secondary source of income for those operating farms with sales of $10,000-$249,999, and is a primary source of income for those operating farms with $250,000 or more in sales. This chart is found in the April 2013 issue of Amber Waves.