
U.S. potato prices drop as production surges
- by Economic Research Service
- 4/24/2013
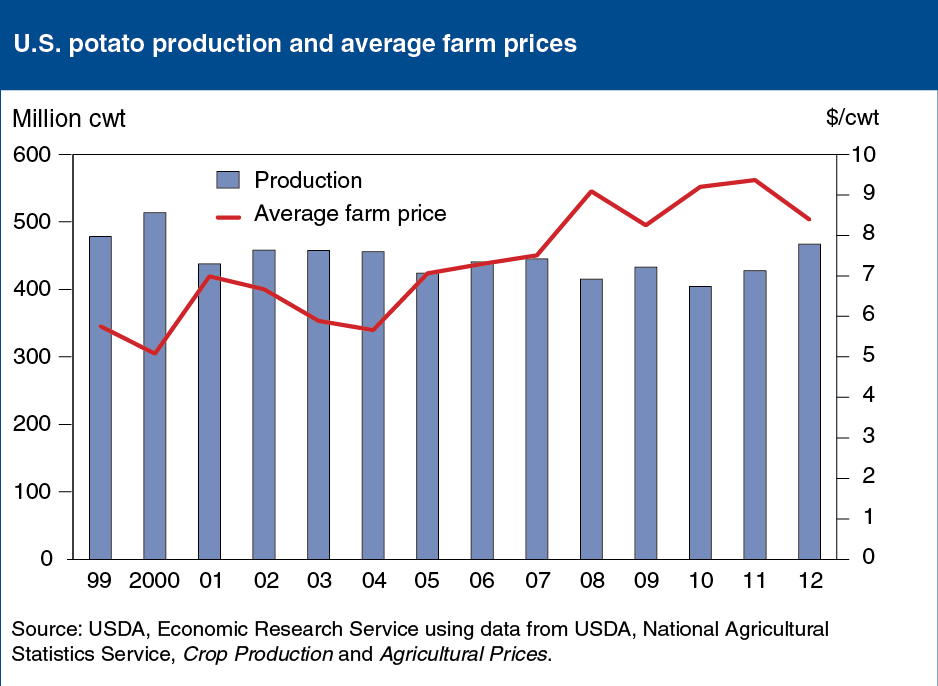
In 2012/13, U.S. potato production increased 37.5 million hundredweight (cwt) to 467 million cwt, making it the largest crop since 2000, when 523 million cwt was produced. Most of the increased output was in areas with high potato processing capacities, including Idaho and North Dakota. Fresh-market prices have fallen because of expanding supplies. Lower fresh market prices are forecast to pull down the average farm price to $8.39 per cwt, a drop of $1.02 relative to the 2011/12 marketing year price. If realized, the price decline will be the largest negative year-to-year change since the 1996/97 marketing year, when average prices fell by $1.84 per cwt in a 12-month period. This chart appears in Vegetables and Pulses Outlook, March 2013.