
Healthfulness of grocery-store food purchases improved little between 1998 and 2006
- by Economic Research Service
- 4/16/2013
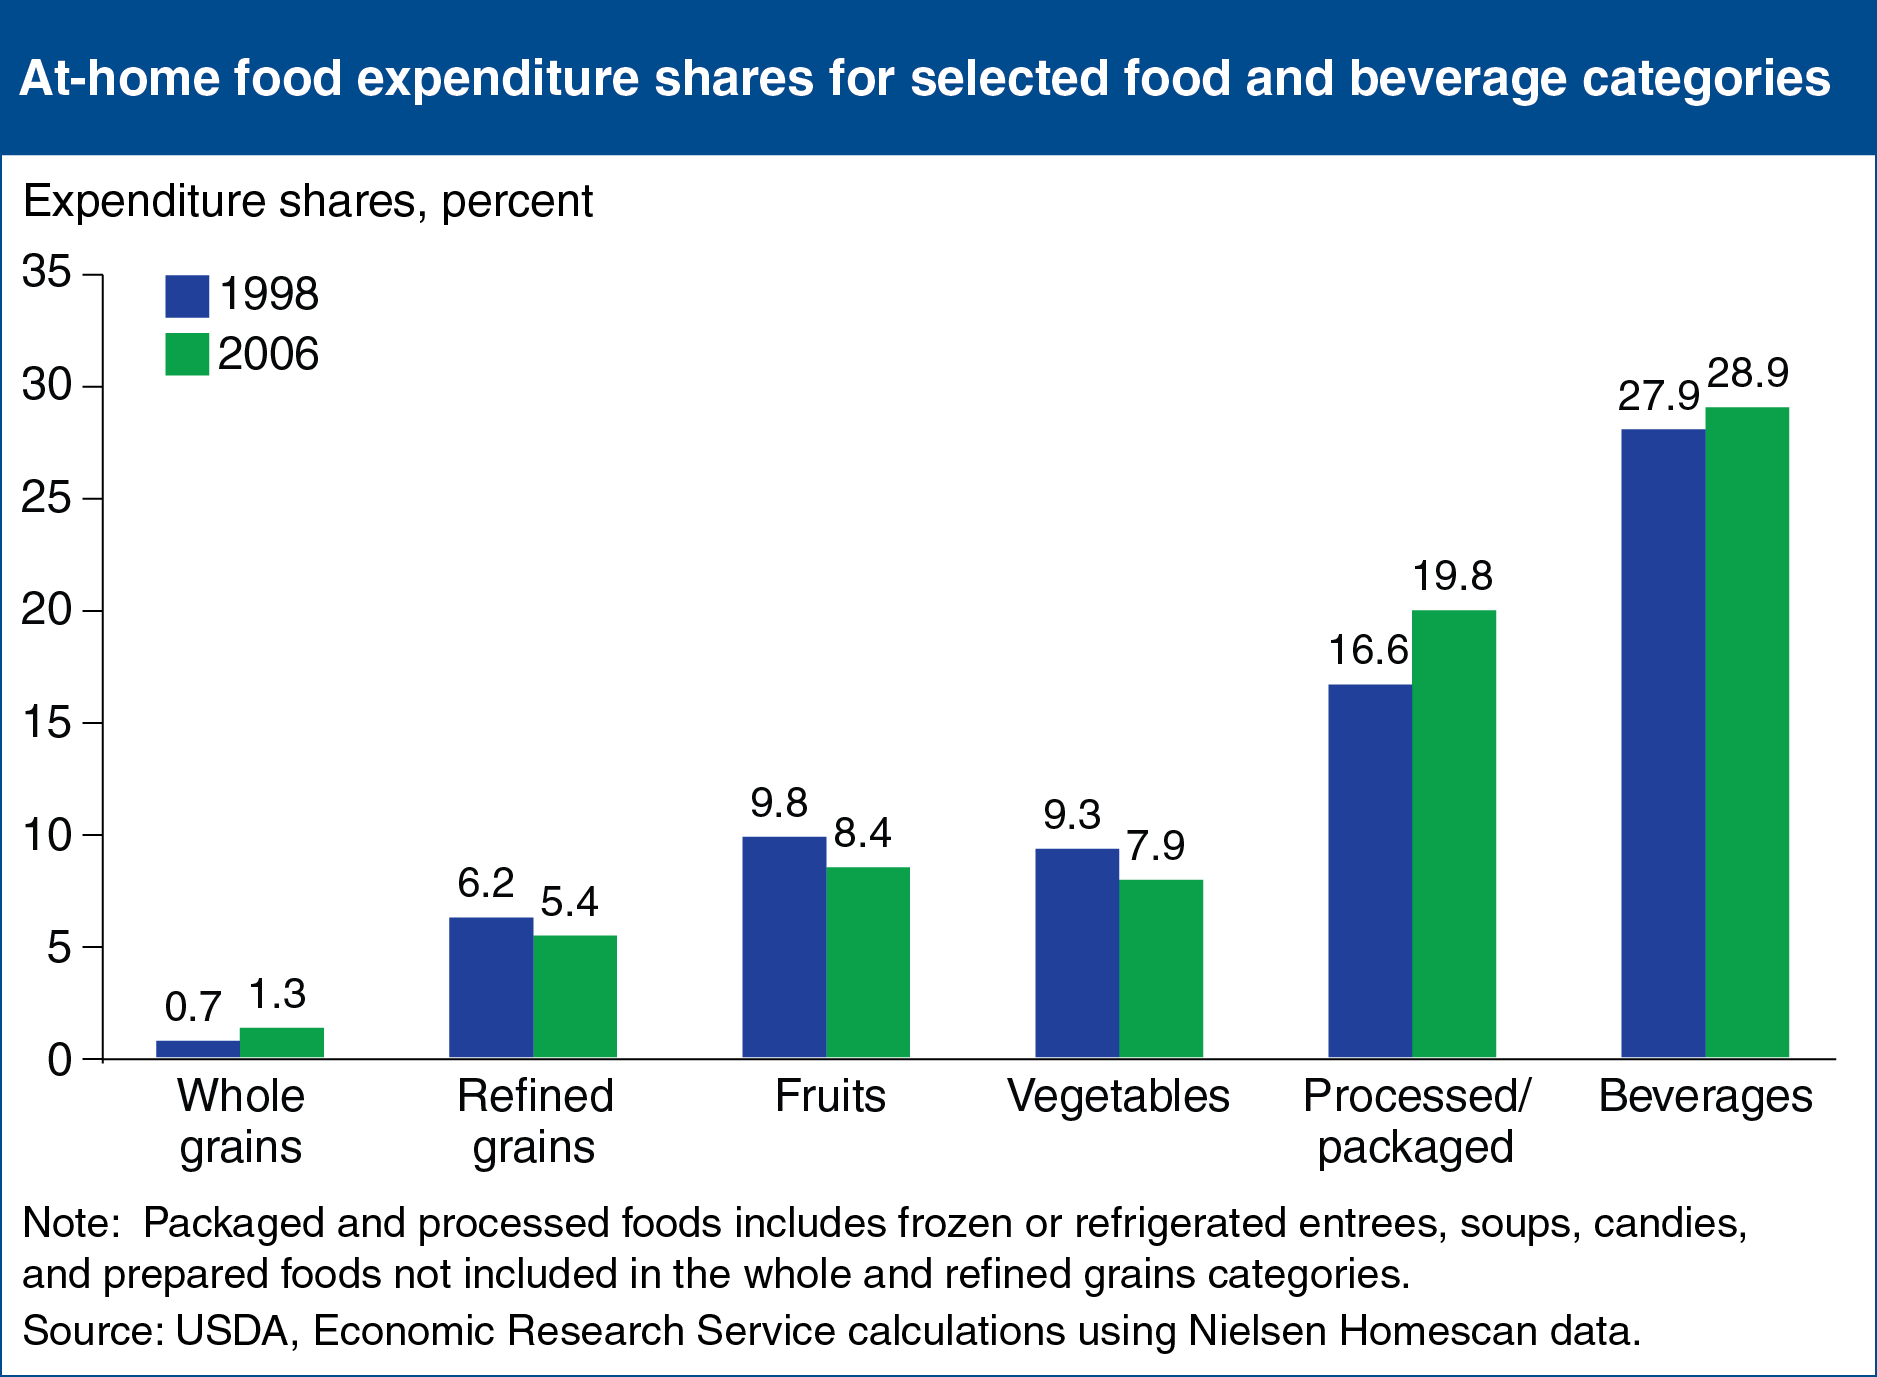
A healthy diet is the result of a chain of decisions extending from food purchase to consumption, with many of those decisions taking place in the grocery store. ERS researchers compared U.S. consumers’ at-home food purchases, as recorded by Nielsen Homescan panelists, with USDA food spending guidelines for obtaining a diet that meets the Dietary Guidelines. The ERS analysis found that food spending patterns showed little improvement between 1998 and 2006, except for an increase in the share of spending devoted to whole grains, coupled with a decline in refined grains’ share. On a less positive note, panelists allocated less of their food budgets to fruits and vegetables and more to packaged and processed foods and beverages. Expenditure shares for fruits and vegetables each fell by 1.4 percentage points between 1998 and 2006, while the expenditure share for packaged and processed foods rose by 3.2 percentage points. This chart appears in the February 2013 Amber Waves feature, Americans’ Food Choices at Home and Away: How Do They Compare With Recommendations?