
U.S. food sales top $1.3 trillion in 2011
- by Economic Research Service
- 11/6/2012
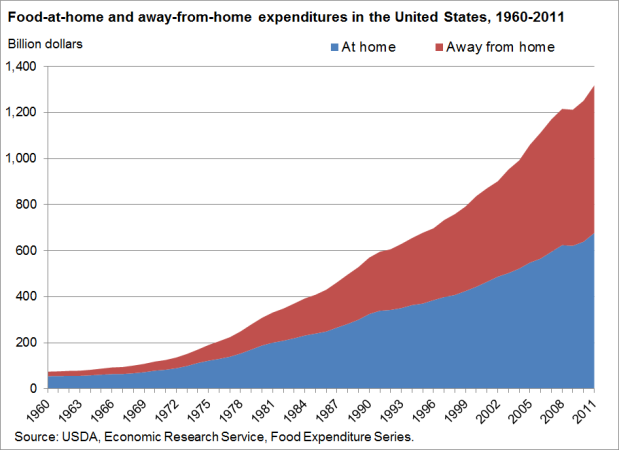
In 2011, U.S. retailers and foodservice establishments supplied $1.32 trillion of food to consumers in the United States. Since 2006, at-home food sales have accounted for just over half (51 percent) of total food expenditures, with the away-from-home market accounting for 49 percent. In 1960, the away-from-home market had a 26-percent share of total food expenditures. Rising incomes and busier lifestyles have led consumers to spend less time cooking and seek the convenience of food prepared away from home. Both at-home and away-from-home expenditures dipped in 2009 causing total food expenditures to fall--from $1.22 trillion in 2008 to $1.21 trillion in 2009. Total food expenditures rebounded to $1.25 trillion in 2010. This chart is based on data from the ERS Food Expenditure Series data product, updated October 2012.